


Achievements
STUDIES OF WATER SENSITIVITY OF THE POROUS MEDIA AT SALINE WATER-FRESHWATER INTERFACE
Zheng Xilai, Zhang Xiaohui, Lin Guoqing,
Wu Junwen, Zhou Jun
College of Environmental Science and
Engineering, Ocean University of China, Qingdao 266003
Abstract: Based on the
geohydrological investigation in the fields, seawater and freshwater were
respectively made to flow through a plexiglass column filled with samples from
the downstream of the Dagu River. Water sensitivity at saline
water-freshwater interface was discussed by changing salinity sharply and
gradually. The results showed that the permeability of porous media decreased
by 50.0% when seawater was flushed by freshwater. However, the decrease of
permeability was comparatively slow and the permeability decreased by 25.1% in
the case of gradual salinity decrease. The faster the rate of salinity
decreased, the larger the reduction degree of the permeability was. A
significant decrease of hydraulic conductivity was observed with time and the
decrease was irreversible. Due to rapid salinity reduction of the influent, the
migration and interception of the released clay particles such as illite,
kaolinite and chlorite resulted in the permeability change.
Keywords: saline
water-freshwater interface , clay particles , porous media, water sensitivity
1 Introduction
The water sensitivity is a phenomenon whereby the permeability of the porous media containing clay minerals decreases rapidly and significantly when incompatible fluids meet the water initially present in the porous media. From 1933 on, Fancher first found the phenomenon of the water sensitivity, it has been investigated by researchers in several contexts [ 1,2,3]: during the process of oil extraction , in irrigation of soils with sodic waters and transport of contaminants attached to colloids in the subsurface. However, little research has been conducted at the saline water-fresh water interface in coastal aquifers. Experimental investigation on irreversible changes of hydraulic conductivity at the seawater-freshwater interface in coastal aquifer was studied by Goldenberg and Magaritz[4].They suggested that an obvious water sensitivity phenomenon existed at the saline water-fresh water interface, that is, the permeability decreases sharpl in porous media when fresh water replaces saline water and the reduction was irreversible with subsequent saline water flushing fresh water. Their further research showed the permeability of the porous media containing 3-4% smectite would create an impermeable layer in an aquifer, while the existence of illite or kaolinite had little influence [ 5].
This paper
examines the phenomenon of water sensitivity of the sample taken from downstream
of the Dagu River by water flooding experiment.Based on the former
researches,the clay minerals of the studied porous media was determined with
a X-ray diffractometer. The absorbance of the clay particles in the
effluent was measured by spectrophetometric to discuss the mechanism of the
changed permeablity .Consequently, the scientific evidence will be presented
for the pridiction and prevention of saline water intrusion .
2 Materials and
Methods
2.1 Experimental
setup
A schematic of the
experimental setup is shown in Fig.1.It mainly consists of three sections: a
bottle with a outlet at the bottom side wall, constant head setup and
plexiglass column. The bottle supplies water to column through constant head
setup and accepts water pumped from a tank to realize water recycle use. The
upper overflow orifice of the constant head setup can retain constant water
level, the two middle outlets can supply water to the column. The column is the
main body of conducting the experiment. Under the condition of constant head,
the permeability can be measured according to the Darcy’s law and
quantitatively expressed in hydraulic conductivity.
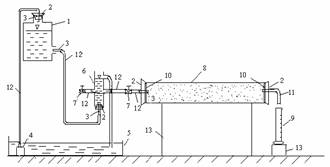
Fig.1 Schematic diagram of the
experimental setup
1bottle 2cork 3glass orifices 4pump 5tank
6constant head setup 7valve 8plexiglass column9measuring cylinder 10bolting
silk 11wingding pipe 12 rubber hose 13holder
2.2 Materials
2.2.1Sand samples
Sand samples were taken from a saline phreatic aquifer in the downstream area of the Dagu river. Before the experiment the grain size of porous media should be analyzed. Larger than 0.5mm fraction was carried out with a sieving method, while smaller than 0.5mm fraction was analyzed with MasterSizer2000. According to the grain size analysis, smaller than 0.5mm fraction occupies about 79.98% of the total amount, smaller than 0.063mm fraction makes up 7.78%, and clay particles of smaller than 0.002mm fraction only occupies 1.7 %.
2.2.2Water samples
Fresh water was
colleted from the Dagu river, and seawater was colleted from the Shilaoren
beach in Qingdao. The chemical compositions of the water were presented in
Table 1. According to the chemical analysis of water sample, river water is
SO4-Na type and seawater is Cl-Na type. Before the experiment, the water
samples were filtered to avoid the effect of impurity.
Tab.1 Chemical
compositions of used water samples
|
|
Na+ |
K+ |
Ca2+ |
Mg2+ |
Cl- |
SO42- |
HCO3- |
EC |
|
Seawater River water |
8534.78 73 |
418.09 27.16 |
289.30 68.94 |
1094.98 14.10 |
18220.7 148.89 |
2779 151.29 |
165 97.63 |
48500 746 |
Values are in mg·L-1, EC is electrical conductivity.
2.3 Water flooding
experiment with saline water and freshwater
2.3.1Water shock
experiment
Water shock
experiment involves flowing a high concentration of seawater and then switching
the flow to a low concentration of fresh water. This experiment is designed to
estimate the maximum possible reduction of permeability of porous media [6].
After the sand
sample was air-dried, smaller than 2mm fraction was packed in
plexiglass column, 25cm long and 2.8cm in diameter. Knock
the column wall when packing the sand sample to keep the column uniform and
dense. Then, the packed column was vacuumized for 15 minutes with an
AUTOSCIENCE vacuum pump and saturated with the seawater. Saturated column was
placed horizontally to minimize gravitational movement of grains along the
column. Seawater flowed into the column at constant hydraulic head. Hydraulic
conductivity was determined
after the flow rate of the column remained stable with the Darcy’ law
was determined
after the flow rate of the column remained stable with the Darcy’ law
 (1)
(1)
where  is
volumetric flow rate in m3/s;
is
volumetric flow rate in m3/s;  is flow area
perpendicular to
is flow area
perpendicular to  in m2;
  is flow path
length in m;
is flow path
length in m; is hydraulic head
in m;
is hydraulic head
in m;  denotes the change
in over the path
denotes the change
in over the path  .
.
Replacing seawater
with river water, the hydraulic conductivity was determined at different time
with the above described method until the permeability was stable. Finally, a
switch back to seawater was to assess the reversibility of the observed permeability
reduction. During the experiment, the electric conductivity of the effluent
water was measured with model conductivity meter, DDS-307A.
2.3.2 Gradual
salinity decrease experiment
Gradual salinity
decrease experiment is designed to test if the rate of salinity decrease has
any effect on the permeability change. The type of water was changed for
several times. Seawater was flushed with a mixture of 50% seawater + 50% river
water, followed by a mixture of 10% seawater + 90% river water, a mixture of 5%
seawater + 95% river water, the river water, and then seawater. Finally it was
flushed with river water again. Other preparation and measurement were the same
as the water shock experiment.
2.3.3Measurement
of the clay particle concentrations in effluent water
If the effluent
water is turbid, the release phenomenon may take place during the experiment.
Absorbance of the effluent water was measured spectrophotometrically with a 721
Spectronic at 600nm.A calibration curve was used to convert absorbance values
to particle concentrations.
2.3.4Determination
of the mineralogical compositions in effluent water
Mineralogical
compositions in the effluent water were determined with a Japanese-produced
D/max-rB model X-ray diffractometer using CuKa radiatio at 40kv voltage,
150mA electric current, 0.02°of step, 6°/min o f scanning speed, and 3-60°of
scanning range.
Mineral contents
were calculated with the following equation :
 (2)
(2)
Where  is the relative
percentage of mass
is the relative
percentage of mass  .
.  is the diffractive
intensity of mass
is the diffractive
intensity of mass  .
.  is the
corresponding diffractive intensity coefficient.
is the
corresponding diffractive intensity coefficient.  is the total
number of the mass.
is the total
number of the mass.
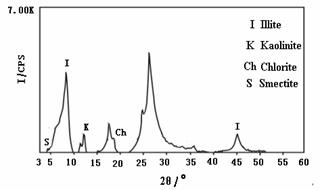
X-Ray diffraction
patterns of the clay particles in the effluent were shown in Fig.2. The
released clay particles include illite, kaolinite,chlorite and smectite
(montmorillonite). According to the calculation with equation(2), illite is about
84% , kaolinite and chlorite are 15 %. The result showed the non-swelling clay
minerals dominated the detached particles and there was little of swelling smectite
(montmorillonite).
3 Results and Discussion |
3.1 water
shock experiment
In this process,
sea water and river water were applied in the replacement tests (Fig.3). Hydraulic
conductivity in the column decreased from 5.54×10⁻²cm/s to 3.81×10⁻²cm/s
during the first five minutes. The permeability decreased by 31.2%. When the
experiment lasted for 140 minute, the hydraulic conductivity decreased to
2.77×10⁻²cm/s , and the permeability decreased by 50.0%.The
hydraulic conductivity increased from 2.77×10⁻²cm/s to 2.91×10⁻² cm/s
when seawater was used for replacement again ,while produced a slight increase
in permeability. Until the end of the experiment, the hydraulic conductivity
decreased to 3.03×10⁻³cm/s, the total permeability decrease reached
one order of magnitude. The salinity change during the experiment could be seen
too in Fig.3. Flowing seawater, the electric conductivity of the effluent water
was 496848μs/cm, when seawater was replaced by river water, there was no change
for EC at the beginning, but EC decreased sharply to about 1000μs/cm after 20
minutes. The time when electric conductivity began to decrease was related to
the porosity of the used sand sample, and it lagged after hydraulic
conductivity changes.
In order to
analyze the hydraulic conductivity change of the porous media, the
concentration and accumulative amount of clay particles in effluent with time
were measured (Fig.4). Fig. 4 showed when the experiment reached 100 minutes
(at the beginning of river water flushing seawater) , clay particles were
observed in the effluent. Before this period, there was no reduction in
permeability of porous media. That is, the clay particles have not begun to
release from the pore walls consequently and no effect on the permeability
change. According to the X-ray diffractive analysis, non-swelling clay minerals
such as illite, kaolinite and chlorite were abundant in the detached
particles. In this case, rapid reduction of salinity causes these non-swelling
clay minerals to develop sufficiently high potentials to cause the repulsive
forces larger than attractive van der Wals forces. The balance between the clay
particles and its attached matrix is destroyed, so the clay
particles are detached from the surface [7]. Once released, the
particles can either redeposit on the matrix, be transported with the flow, or
get entrapped at pore constrictions. When the experiment reached 140 minutes,
the concentration of released particles in effluent reached the peak value.
During this period, the accumulative amount of clay particles increased
rapidly. As the particle concentration increased, more particles are captured
due to bridging or “log-jam” at the pore throat and thus permeability is
reduced significantly. After this period, the concentration of the released
particles decreased and the accumulative amount of the clay particles increased
slowly. When experiment reached 250 minutes, the clay concentration in effluent
was nearly zero, and the accumulative amount of clay particles nearly stopped
increasing, which shows the clay particles may not be released out of
the column.. With the continuance of the experiment, the decrease of the
permeability continued, which showed the clay particles redeposit in the
column.
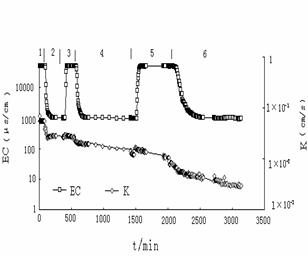
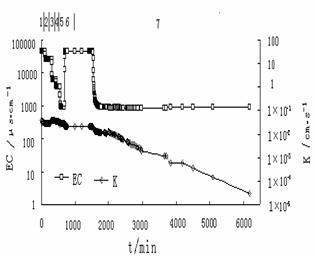
3.2 Test for
Gradual salinity changes
This process
included six replacing courses of seawater , different proportional mixture of seawater
and river water and river water. Relation curves of electric conductivity and
hydraulic conductivity with time in the case of gradual salinity decrease
experiment were shown in Fig.5. The hydraulic conductivity was 3.34×10⁻²cm/s
with only seawater. Then, it decreased to 2.86×10⁻²cm/s and it only
decreased only by 14.4% after a change to a mixture of 50% seawater
+ 50% river water. The permeability increased slightly when flow was
switched to a mixture of 10% seawater + 90% river water. However, the
permeability decreased by 25.1% with the increasing river water percentage.,
hydraulic conductivity continued to decrease subsequently with sea water
replacing river water .Finally, the hydraulic conductivity decreased to 2.92×10⁻⁵ cm/s,
and the permeability decreased by three orders of magnitude .With the increase
of the percentage of river water, electric conductivity value decreased in a
ladder pattern and reduced to the lowest when 100% river water flowed in the
column. The highest value and the lowest value of electric conductivity were
the same as the measurement of the water shock experiment.
Relation curve of
the concentration and accumulative amount of particles in effluent with time in
the case of gradual salinity decrease are present in Fig.6. When experiment
reached 14500 minutes, clay particles began to appear in effluent. Before this
period, there was no clay particle flowing out of the column with gradual
salinity change. Comparing Fig. 4 to Fig.6, the total accumulative amount of
the clay particles in effluent was 33 mg in the case of gradual salinity
decrease while it was 145mg in water shock experiment. In addition the time for
release out of the column was more than 600 minutes, which was four times than
that for the water shock experiment. Since the less amount particles were
release over a long period of time, many clay particles do not arrive at the
pore throat at the same time to cause a “log –jam” effect. Therefore, the
number of clay particles captured is lower and reduction in permeability is
also lower.
Comparing the
permeability change with time for water shock experiment and gradual salinity
decrease experiment, the reduction degree of permeability depends not only on
the salinity but on the rate of the salinity decrease. The faster the rate of
salinity decreased, the larger the reduction degree of permeability was.
Therefore, reducing the rate of the salinity decrease can weaken the degree of
the permeability declining.
|
||||
|
||||
|
||||
|
||||
4 Conclusions
(1) Replacing
seawater with river water, there existed a obvious water sensitivity at saline
water-freshwater interface. In the case of sharp salinity change, the
permeability decreased by 50.0%. In the case of gradual salinity decrease, the
permeability decreased comparatively
slow and decreased by
25.1%.
(2) The permeability reduction depends not only on the salinity but also on the rate of the salinity decrease. The faster the rate of the salinity decrease, the larger the reduction degree of permeability is. A significant decrease of hydraulic conductivity, of three orders of magnitude, was observed with time and the decrease is irreversible.
(3) The migration and interception of the released clay particles such as illite, kaolinite and chlorite due to salinity changes of the influent result in the permeability change.
References
[1] Ochi J, Vernoux J
F. Permeability decrease in sandstone reservoirs by fluid injection
hydrodynamic and chemical effects [J].Journal of Hydrology ,1998,208:237-248.
[2] Shainberg I,
Rhoades J D, Prather R J. Effect of low electrolyte concentration on clay
dispersion and hydraulic conductivity of a sodic soil [J] Soil Science Society
of America Journal,1981, 45:273-277.
[3] Sen T K, Khilar K
C. Review on subsurface colloids and colloid-associated contaminant transport
in saturated porous media[J].Advances in colloids and Interface
Science,2005:1-95.
[4] Goldenberg L C,
Magaritz M. Experimental investigation on irreversible changes of hydraulic
conductivity on the seawater-freshwater interface in coastal aquifer[J].Water
Resources Research ,1983,19(1):77-85
[5] Goldenberg L C ,
Magaritz M, Amiel A J, et al.. Changes in
hydraulic conductivity of laboratory sand-clay mixtures caused by a
seawater-freshwater interface[J]. Journal of hydrology, 1984, 70: 329-336.
[6] Mohan K K, Vaidya
R N, Reed M G, et al. Water sensitivity of sandstones containing swelling and
non-swelling clays [J].Colloid Surface A,1993,73:237-254.
[7] Khilar K C, Fogler
H S, Ahluwalia J S. Sandstone water sensitivity: existence of a critical rate
of salinity decrease for particle capture[J]. Chemical engineering science,
1983,38(5): 789-800.