Achievements
EFFECT OF SOIL DISTURBANCE ON AQUIFER RECHARGE: CASE STUDY ON THE SNAKE RIVER PLAIN, IDAHO NATIONAL LABORATORY, US
John R. Nimmo and Kim S. Perkins
John R. Nimmo and Kim S. Perkins, USGS,
Abstract: Soil structure and heterogeneity influence the amount of water that percolates below the root zone to become aquifer recharge. Flow through preferential channels can be extremely rapid. Layer contrasts inhibit downward flow. Soil disturbance by agriculture, waste disposal, or land reclamation can severely alter these and other features in ways that affect recharge. We conducted identical experiments in an undisturbed silt-loam soil and in an adjacent simulated waste trench composed of the same soil disturbed by excavation and backfilling to a depth of 4 m. We obtained (1) lab- and field-measured unsaturated hydraulic properties and (2) field-measured transient water content profiles through 24 hr of ponded infiltration and 75 d of redistribution. To explore sensitivities to particular features and processes, we simulated the water content profiles using the VS2DT numerical code. In the undisturbed soil, wetting fronts were highly diffuse above 2 m depth, with clear evidence of preferential flow but not layering. Below 2 m, layer contrasts severely limited downward flow. Darcian analysis of measurements below 2 m depth suggests that long-term average natural recharge is less than 2 mm/yr. In the disturbed soil, wetting fronts were sharp and initial infiltration slower. Without layer contrasts, however, water moved freely but slowly below the root zone. Numerical simulation starting from pre-test water contents predicted sharp wetting fronts, agreeing with measurements in disturbed but not undisturbed soil. Simulation starting from the macropore-flow-affected moisture profile of 3 hr after the start of infiltration, however, gave good predictions of undisturbed-soil infiltration and redistribution for the entire 75 d of data. Overall results suggest that soil disturbance, although it reduces preferential flow, may increase aquifer recharge if it neither leaves intact nor creates flow-impeding layers.
Key words: recharge, unsaturated zone, vadose zone, anthropogenic effects, hydraulic conductivity, water retention.
Introduction
Soil structure and heterogeneity are major complicating factors affecting aquifer recharge through the unsaturated zone. Flow through macropores (pores large enough that they conduct water markedly faster than the pores between closely packed grains) can be extremely rapid when they are filled with water. Layers within the soil, even when contrasting only subtly, have a basic flow-inhibiting effect, which is known from basic unsaturated flow theory and supported by experiments (Miller and Gardner, 1962; Jury and Horton, 2004). Layers also play a role in preferential flow, being a direct or indirect cause of funneled flow (where flow deflected in direction becomes spatially concentrated with a local increase in water content and therefore in hydraulic conductivity and flux) and unstable or fingered flow (caused by temporary flow-enhancing conditions of parts of the medium, which typically occur where adjacent layers contrast in pore structure or wettability). Because in the soils at our field site macropores are more strongly apparent than features that would funnel flow or generate instabilities, in this paper we refer to macropore flow as the predominant mode of preferential flow with the understanding that sometimes funneled or fingered flow may be lumped together with it. Together, macropores and layers manifest both flow-inhibiting and flow-enhancing effects. To know how these complementary and opposing effects act together in controlling downward flow, we need understanding of the processes of flow in heterogeneous soils of complex structure.
To assess the effect of specific structural features, much can be learned from controlled experiments on soils with and without the features of interest. In particular, the study of soil with and without modification of its natural macropore and layer structure is valuable. Many studies have considered the effect of tillage on hydraulic properties, mainly for agricultural applications (Klute, 1982). Typical studies of this type (Allmaras et al., 1977; Quisenberry and Phillips, 1978; Hamblin and Tennant, 1981; Allmaras et al., 1982; Azooz et al., 1996) suggest that sometimes the loosening aspects of tillage dominate, while sometimes compactive or pore disrupting aspects dominate. Bouma et al. (1975) found that cultivation of soil reduced its saturated hydraulic conductivity, as if from macropore destruction, but through effects on layers and unsaturated hydraulic conductivity, tended to increase deep percolation. Strip-mine reclamation studies are also relevant (Dunker et al., 1995; Johnson and Skousen, 1995) in that reclaimed soil does not have all of the flow-affecting structural features that were present before mining. The waste-site study of Andraski (1996) in the Amargosa Desert of Nevada shows an increase in vapor transport and a reduction in flow-impeding effects of layer boundaries when the subsurface is disturbed by the emplacement of a waste trench. Comparing data from various studies, Gee et al. (1978) report comparisons of water retention and hydraulic conductivity (K) for disturbed and undisturbed soils, the most pronounced difference being markedly lower saturated and unsaturated K in disturbed material. Effects of disturbance have also been studied with repacked soil columns, which can involve a more drastic disturbance than typically exists in a field setting. Jayawardane and Prathapar (1992) for example repacked soil samples with the deliberate intention of increasing porosity. An expected effect of disturbance is a more pronounced air-entry effect in the drying water retention curve. This is consistent with an expected reduction and homogenization of the largest pores of the medium caused by the disturbance. For silty material from a 45-m deep layer that had been altered by baking during the deposition of molten lava, Perkins (2003) measured soil water retention for undisturbed cores and for samples that were disaggregated and repacked to the same porosity. The undisturbed material was macroporous with highly cemented aggregates formed as a result of the baking process. Retention curves of the repacked samples showed a sharper air-entry effect and a narrowing of the pore-size distribution.
Controlled investigation of both undisturbed and disturbed soil is particularly useful for discerning structural effects on unsaturated flow that determines how much of it becomes recharge. Previous studies provide data sets of this type in the vicinity of radioactive and hazardous waste buried in a silt loam soil (fine-loamy, mixed, thermic, typic calcixeroll) at the Idaho National Laboratory (INL) on the Snake River Plain (Kaminsky, 1991; Shakofsky, 1993; Shakofsky, 1995; Shakofsky and Nimmo, 1996; Nimmo et al., 1999). Measurements with identical procedures have allowed for comparable characterization of the hydraulic properties of both undisturbed soil and disturbed soil from a simulated waste trench nearby (Figure 1). These characterizations include both lab and field methods. The field tests involved a sequence of measurements of water content profiles during ponded infiltration and during subsequent redistribution with suppression of evapotranspiration and of further infiltration.
With results of these studies, we applied a numerical Darcy-Richards-based unsaturated flow model to see how well the measured site characteristics can predict water flow. The simulations provide a link between lab-measured properties and field-measured soil water behavior.
The main purpose of this study is to facilitate understanding of how a mechanical disturbance that disrupts the macroporous and layered character of natural soil influences downward water flow that percolates deep enough to become aquifer recharge. We contribute to this understanding by quantifying the difference, at a site at the INL on the Snake River Plain, between disturbed and undisturbed soils in affecting the transport of water through the root zone that eventually becomes recharge.
Experiments
Mapped in Figure 1, the study site is in a designated USGS test area adjacent to the Subsurface Disposal Area at the INL. In this disposal area, radioactive and mixed hazardous wastes have been buried in shallow pits and trenches since 1952 (Davis and Pittman, 1990). The location is in a shallow topographic depression of wind- and water-deposited sediments, underlain by basaltic lava flows. The surficial soil consists of about 3 to 6 m of sand, silt, clay, and lesser amounts of gravel (Rightmire and Lewis, 1987), and is primarily of silt loam texture. Bartholomay et al. (1989) describe its mineralogical composition.
There are two focus areas of this study. One is a simulated waste trench constructed by the USGS in 1986 by excavating and replacing the soil to a depth of several meters (Figure 2). The other is nearby undisturbed portions of the USGS test area that have not been used agriculturally or artificially altered. Shakofsky (1995) and Nimmo et al. (1999) reported measurements by identical procedures on the simulated waste trench and on nearby undisturbed soil. Methods for determining hydraulic and other soil properties included field observational and measurement techniques, bulk-sample techniques, and laboratory techniques using core samples obtained with a minimally disrupting, hand-operated hydraulic sampling device.
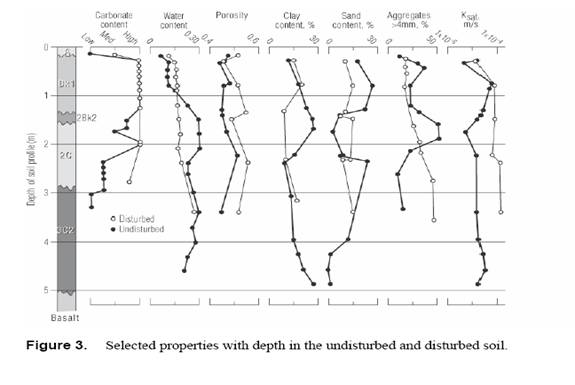
Figure 3 shows a basic characterization of properties of the disturbed and undisturbed soil profiles. There is clear evidence of distinct horizon development in the undisturbed profile. The disturbed soil of the simulated waste trench is much more homogeneous; the absence of natural layers is evident in the relatively smooth profiles of the carbonate content, clay content, and aggregate distribution. In the 1.4- to 2.2-m interval of the undisturbed profile, the greater clay content may cause the greater moisture content as well as increasing interparticle cohesion to cause the greater aggregate size. Similarly, an inverse relationship appears between saturated hydraulic conductivity (Ksat) and aggregation. An exception to the trend in homogeneity is the porosity, which varies with depth about equally in the two profiles, and is about 5 percent greater in the simulated waste trench, a likely result of loosening of the soil. Construction of the simulated waste trench has created an essentially unlayered, homogenized soil with increased porosity.
Pittman (1989; 1995) describes the installation of neutron access holes at the site and presents water content data obtained over time with a neutron-scattering probe. Additional long-term soil moisture and meteorological data for the site are reported by Perkins et al. (1998) and Perkins (2000). Shakofsky (1995) gives additional information about the soil horizons and related data, including carbonate content, particle size distributions, aggregate size distributions, and saturated and unsaturated hydraulic properties.
Lab Experiments: Hydraulic Property Measurements on Core Samples
Measurements were made on minimally disrupted soil core samples, including at least two each of disturbed and undisturbed from nine depths between 18 and 340 cm. The main objectives were to obtain water content (θ) expressed as a function of matric pressure (ψ), and K expressed as a function of θ.
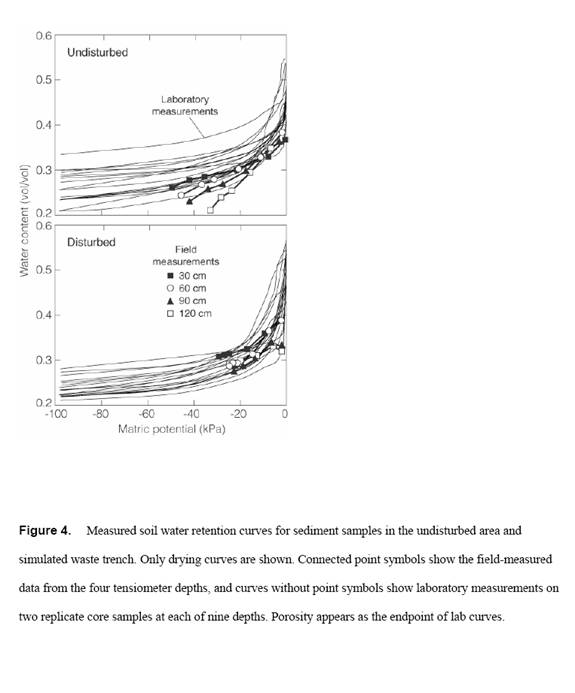
Water retention was measured with a modified pressure-cell assembly, the submersible pressure outflow cell (SPOC) (Constantz and Herkelrath, 1984). Pressure increments were applied to an initially saturated soil. A strict criterion for equilibration at each point (Nimmo et al., 1999) and the close spacing of points, especially in the wettest portion of the curves, provided for high resolution data for evaluation of structural effects. The curves (without point symbols) in Figure 4 illustrate a portion of the data set, the drying retention curves. The main shape features of the lab-measured drying curves – the air-entry very near zero matric pressure, the abrupt drop to a bend between -10 and -30 kPa, and the nearly flat tail beyond the bend – differ little between the undisturbed and disturbed media. The shapes are typical of structured surface soils, not repacked samples. The most obvious disturbance-related distinction is that there is more spread among the undisturbed curves, indicative of more pronounced layers as evident also in Figure 3. Measured wetting curves (not shown here) suggest essentially the same disturbance-related generalizations as the drying curves.
The K(θ) values used in numerical modeling were
generated using the one-step outflow method (
Field experiments
Simulated floods allowed assessments of the behavior of water in the unsaturated zone. The transient water-content profiles measured in these field tests with a neutron soil-moisture probe were the standard of comparison for our numerical simulations. The measurements also permitted calculation of hydraulic properties by the instantaneous profile method as reported by Nimmo et al. (1999) and Kaminsky (1991).
These experiments involved 24 hours of flood infiltration followed by redistribution with the surface covered to prevent evaporation. This was done in two bermed areas, one in undisturbed soil and the other within the simulated waste trench (Figure 1). Each rectangular 2.0×4.4-m bermed area enclosed two neutron access holes (nos. 2 and 3 in the undisturbed soil and nos. 15 and 19 in the disturbed, Figure 1) and eight field tensiometers at depths of 30, 60, 90, and 120 cm. Water was applied to the two bermed areas and ponded 8 cm deep. Water content and matric pressure profiles were measured for 11 weeks.
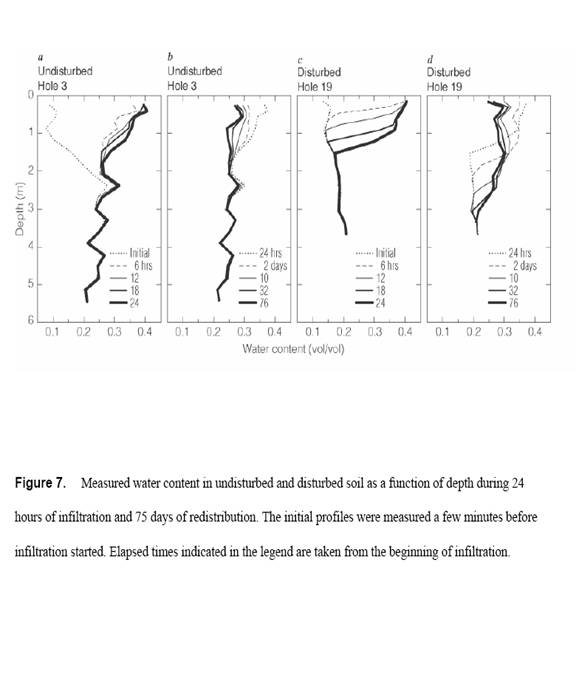
Figure 7 shows water-content profiles at representative neutron access holes over 76 days of measurement. The maximum water contents (θmax) during ponded infiltration are less than the porosity of the media, indicative of trapped air. In the undisturbed soil the wetting fronts were diffuse and ill-defined, as found also for example in a cracked soil by Mitchell and van Genuchten (1993); a small portion of the water goes to 2 m depth in less than 6 hr. During redistribution, the main effect in undisturbed soil is loss of water from the upper 2.5 m. The water lost must either spread laterally beyond the range of neutron-probe sensitivity, or flow steadily downward through a zone of effectively uniform ψ. This behavior overall suggests a strong influence of macropores in the top 2 m, and flow-impeding layering below 2 m depth. In the disturbed soil the wetting fronts were sharp with high and fairly uniform θ behind, resembling those commonly observed in repacked soil samples. As would be expected for homogeneous soils when evaporation is negligible, redistribution closely follows a constant-area rectangular pattern. Water appears to move easily and uniformly downwards. It reaches 3 m depth in about 32 days and shows no evidence of having stopped, even after 76 days.
The shape and behavior of these θ profiles suggests that both layering and preferential flow paths are more significant in the undisturbed than the disturbed medium. In the disturbed soil the infiltrated water appears to remain within the measured profile, perhaps because in the absence of a significant impeding layer there is less lateral flow.
Field-measured soil water retention curves created by pairing θ measurements with simultaneous ψ measurements from the tensiometers at four depths are in Figure 4. Except for the driest field measurements at 120-cm depth, there is good consistency between the lab and field results. The trend in undisturbed soil shows less retentivity at greater depth.
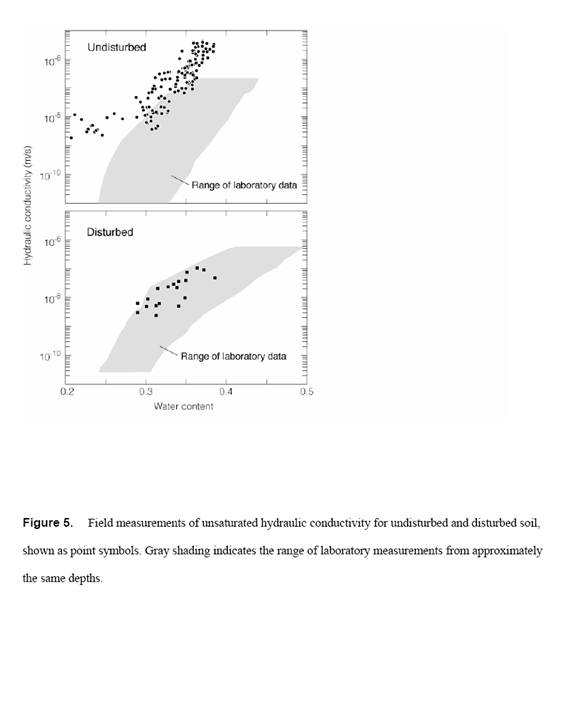
The instantaneous-profile measurements of K, based on fluxes computed from the neutron-measurements of water content and gradients computed from the tensiometer measurements, are in Figure 5. Many of the lab and field results agree within about an order of magnitude, fairly good agreement for the methods used. Basile et al. (2003) also compared field instantaneous profile measurements with estimates based on lab measurements, finding the field-measured K values to be greater. The same trend appears in our results for the undisturbed soil, but to a much lesser degree in the disturbed soil. The better field-lab agreement for disturbed soil may result from a scale effect that is greater for the more heterogeneous undisturbed soil.
Numerical Simulations
We applied a modified version of VS2DT (Lappala et al., 1987; Healy, 1990) to quantitatively relate the water flow observed in the field to the laboratory-measured properties. This code is a finite difference approximation to the solution of Richards’ (1931) equation, thus embodying generally accepted Darcy-Richards unsaturated flow theory, i.e. the combination of Darcy’s law with the continuity equation. The laboratory measurements of hydraulic properties of the INL soils were fit with van Genuchten (1980) curves for use in the model. Modifications of VS2DT for this study accommodated 36,000 nodes, 99 component media, and soil-water hysteresis.
Our sequence of simulations progressed from simple to complex. The first used an elementary one-dimensional model. Successive simulations incorporated various refinements such as hysteresis, two-dimensionality, and increased detail of layered structure. We could then evaluate the general adequacy and importance of individual refinements.
Simple model
The first one-dimensional simulation used lab-measured properties averaged over each observed soil horizon (five layers) of the undisturbed medium and averaged over the entire profile of the disturbed medium (Nimmo et al., 1999). The initial condition in each case was a water content of 0.16, approximating the average initial water content in the field profiles. The boundary condition at the top of the profile was 8 cm of ponded water for the first 24 hours, and zero flux thereafter.
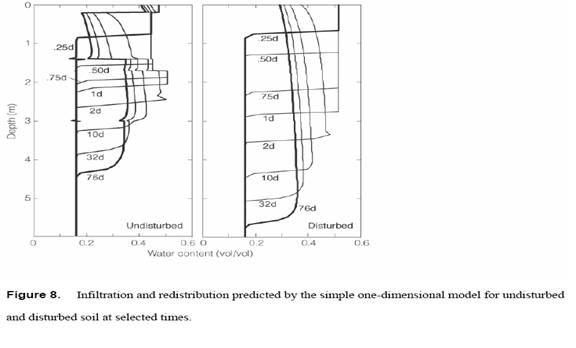
During both infiltration and redistribution the one-dimensional model simulations (Figure 8) give essentially rectangular profiles with sharp wetting fronts, resembling measurements for the disturbed but not the undisturbed soil. The predicted downward movement is fairly steady, as would be expected if there were no macropores or significantly contrasting layers. Quantitative differences in unsaturated hydraulic properties of the individual soil horizons of the undisturbed medium (Figures 4 and 5) seem to affect results chiefly as (1) variation in the maximum attained water content under ponding (θmax), stemming in part from the variation in porosity, and (2) variation in rate of drainage, most obviously in the rapid loss of water from the 0.2 to 1.3 m layer. Downward flow is faster than observed (Figure 7) for nearly all cases. The main exception is undisturbed soil during the infiltration period. The simulations show consistently faster movement in the disturbed soil, in disagreement with observations except late in the redistribution period. Except for a qualitative agreement with the general shape of profiles in the disturbed soil, the simple one-dimensional model inadequately simulates the major features of the measured profiles: (1) diffuseness of the wetting front and (2) inhibition of flow below 2 m in the undisturbed soil, and (3) the rate of water movement in both soils.
Model with altered parameter values
Air trapping and other phenomena are likely to cause the actual field values of θmax and Ksat to differ from the lab-measured values of porosity and Ksat used in the initial simulations. In effect, the values of these two parameters control the dimensions of the rectangle that approximates the infiltration-influenced part of the predicted profile. For more realistic θmax values, we used the water content measured in the laboratory after preparatory wetting of the core samples under ponded water (Table 1).
For the undisturbed soil, we used PEST software (Doherty et al., 1994) in combination with VS2DT to find the optimum Ksat value for the closest simulation of field-measured θ. Fit quality remained poor and showed only weak sensitivity to the value of Ksat. This suggests that for undisturbed soil the Ksat and θmax parameters do not seem to contain the information necessary to represent effects of layers, macropores, or other features of the medium not well handled by the simple model.
For the disturbed soil, the combination of a realistic θmax and a Ksat adjusted to about one-half of the measured average resolved the major quantitative discrepancies between measured and modeled θ profiles.
Model with realistic enhancements
We further enhanced the numerical simulations by incorporating more realistic representations of key features of unsaturated flow, with the goal of seeing which if any of these features might enable a qualitatively adequate prediction of the undisturbed-soil profiles. The main enhancements included:
(1) Two-dimensionality. This permits lateral diversion of water as expected because of the finite dimensions of the infiltration area.
(2) Hysteresis. The modified version of the VS2DT code with explicit treatment of hysteresis accounted for the fact that wetting occurs in the advancing front of the profile while drying occurs in the trailing region as it is depleted of water. The measurements of Shakofsky (1995) and Nimmo et al. (1999) include both drying and wetting water retention data. We extended the wetting data to cover the same ψ-range as the drying data using the hysteresis model of Nimmo (1992). We assumed that all hydraulic-property hysteresis was represented in the water retention, i.e. that there was hysteresis in K(ψ) but none in K(θ).
(3) Finer resolution of layers. Using the full data set reported by Nimmo et al. (1999), we modeled nine layers in both the undisturbed and disturbed soils using an average of two replicate core-sample measurements to characterize each layer. Layer boundaries were taken to be midway between the nine sampling depths.
(4) Measured initial conditions. As the initial condition (IC) for the water content profile, we used the θ values measured immediately before infiltration began.
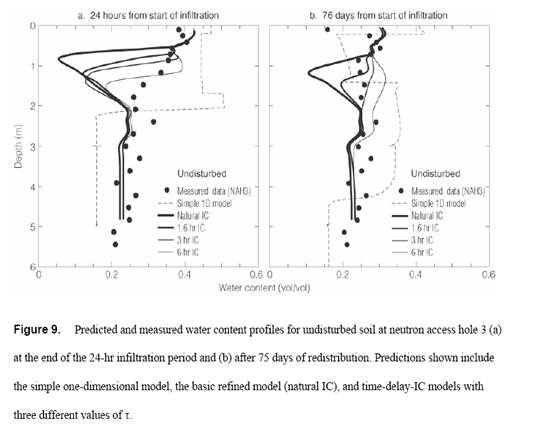
Although these enhancements improve the realism of the model, none of them significantly improved the simulated profile shape for undisturbed soil. Figure 9 shows their combined effect as curves with the thickest line (labeled Natural IC).
Model with artificial alteration of initial conditions
We also tested the numerical model with the IC based not on pre-infiltration water content distribution, but on water content measured at a selected time (τ) after the start of infiltration. Figure 9a shows time-delay-IC predictions at the end of the 24-hr infiltration period. Three curves illustrate the effect of different values of τ. The use of the time-delay IC forces the simulations to exhibit a more diffuse wetting front, thus producing somewhat better agreement with the shape of the measured profile. A similar comparison at the end of 75 days of redistribution (Figure 9b) also shows simulations that are significantly more realistic in shape, especially for the 3 and 6 hr values of τ. Thus some processes occurring in the first few hours of infiltration are a significant influence even 11 weeks into the redistribution period. If the initial condition is taken to be the measured profile a few hours after the beginning of infiltration, it can resolve much of the discrepancy found between measurements and the simple and enhanced models as described above. Discussion
Hydraulic Properties
The general character of the hydraulic properties is similar between the undisturbed and disturbed soil. The effect of macropores is not obvious in the measurements either on core samples or in the instantaneous-profile-method field results. Differences in properties among soil layers are apparent, though more subtle than would be expected from observed soil-water behavior in the field.
The property measurements show slight disturbance-related differences in water retention and unsaturated K, greater vertical and horizontal heterogeneity in the undisturbed medium, reasonable agreement of lab and field measurement techniques, and reasonable basic agreement between steady-state centrifuge measurements and those of other methods. Tendencies in the slopes of hydraulic conductivity and water retention curves are consistent with a reduction in breadth of the pore-size distribution caused by waste-trench construction. For example, K tends to be less sensitive to θ in the disturbed soil. This implies that in the disturbance of waste-trench construction, some of the largest pores are made smaller (as by reducing interaggregate gaps) and some of the smallest pores are made larger (as by crushing aggregates).
Better knowledge of K at high water content might help in the incorporation of macropore influences into predictive models (e.g. Leummens et al., 1995). For a given θ near saturation, the intrapore air content (for these INL soils, about 20% of pore volume just after infiltration) may represent unfilled macropores, or trapped air in small pores. These distinct possibilities have drastic implications for K, as they determine whether water does or does not fill the largest pores. Even the representation of K(θ) as a mathematical function may be misleading, as there can be significant hysteresis.
Response to simulated flood
Field water-flow behavior differs between the undisturbed and disturbed locations much more than do the individually measured properties. Thus the recharge rates may be affected more than is apparent from measurements of hydraulic properties of core samples. During artificial flood infiltration, there is rapid wetting throughout a 2-m thickness in the undisturbed soil, but a sharp, slower moving wetting front in the simulated waste trench. Preferential flow, likely conducted through macropores, is substantial in the undisturbed soil, permitting rapid downward flow in the shallowest layers.
Water flow is impeded at 2 m depth in the undisturbed but not in the disturbed medium. Natural layering appears to be an effective retarding influence on downward flow, even at modest depth. In the disturbed soil there are few pathways of fast preferential flow, but also no barriers, so water moves freely and uniformly to deeper depths. The destruction of impeding layers at such depths may be particularly effective for increasing aquifer recharge, because at the deeper depths reached in the disturbed soil, water may largely evade the opportunity for removal by evapotranspiration. Though developed for vertisols, the concept of a maximum crack depth (Chertkov and Ravina, 1998) is consistent with the observation here of a depth below which macropore flow is insignificant.
Interpretation with respect to unsaturated flow theory
For disturbed soil, measured and modeled results agree qualitatively, in the shape of the water content profile (Figures 6c, 6d, and 7b). With adjustment of soil-water property parameters there is reasonably good quantitative agreement as well. Water behavior in the disturbed soil may resemble that in columns of repacked soil, or possibly that of cultivated agricultural fields. This would suggest the Darcy-Richards formulation works well for the types of media that were commonly studied during the decades of the twentieth century when this unsaturated-flow theory was developed and became accepted.
For undisturbed soil the basic Darcy-Richards approach did not accurately predict the unsaturated-zone response to a small-scale flood. Only the direct observation of water flow in the field indicates the full range of unsaturated-flow behavior at the undisturbed-soil location. The disagreement was qualitative in that significant features of water-content profile shape were absent from the predictions of both the simplest and the most refined models (Figure 9), namely (1) the rapid wetting throughout a 2-m thickness of profile in the undisturbed soil, and (2) the severe impediment to water flow at 2 m depth.
Several factors may cause the modeling to be inadequate. Input hydraulic property values may be insufficiently accurate or detailed. This study, however, used measurements of greater rigor, resolution, spatial detail, and multiple-method corroboration than would normally be available. These measured values create a consistent and reasonable picture of unsaturated flow in a medium altered by disturbance. Preferential flow may be inadequately represented by these properties; in the numerical modeling, preferential flow should already be implicitly included through the measured properties of the media but the modeled results indicate that it is underestimated. One possible reason is that the core samples may be deficient in macropores. Another is that there are no measurements for ψ between 0 and about -10 cm-water, the range where macropore effects are likely to be manifested. New modifications of water retention measurement techniques for application in the range near saturation, like that of Tokunaga et al. (2002), may reveal more and permit better application of the Darcy-Richards approach, but detailed treatment of wet-end unsaturated properties is rare. If such data were available, it is unclear whether they would significantly improve the modeled results. A second consideration is whether layering effects are adequately represented by the properties used in modeling. It is clear that the simulations underestimated effects of layers on flow and that layer effects captured in direct measurements of properties do not explain the marked flow impediment in the undisturbed soil. A minimally permeable layer at about 2 m depth could account for the minimal alteration of θ below that depth in the undisturbed medium. If it were thin enough, such a layer could have gone undetected in our experiments because the core sampling was not continuous. This would not explain the observed evidence for preferential flow, however. A straightforward adjustment of parameter values, though adequate for simulating the disturbed profile, did not lead to substantial improvement in simulating the undisturbed profile. This suggests that the measurements of the basic unsaturated hydraulic properties do not adequately represent soil structure for hydraulic evaluations.
The numerical simulations incorporating hysteresis, layer contrasts, and directly measured soil water properties failed even to qualitatively agree with the profiles observed, which suggests that the Darcy-Richards formulation as implemented with widely used measurement and computational methodology may be unsuitable for modeling soil-water behavior in this undisturbed soil. Such unsuitability could exist if the main controlling factor of the flow were something other than a Darcian direct proportionality between flow rates and potential gradients. An alternative explanation could be that preferential flow paths are underrepresented in the core samples relative to the actual soil in the field; this might be consistent with the measured properties in Figure 5, but our numerical experiments suggest that increased hydraulic conductivity resulting from fuller representation of macropores in samples would not substantially improve the simulated profile shape. Inadequacy of Darcy’s law in this case may stem from the combination of ponded conditions and highly developed macropores. In many natural or artificially modified settings, however, the conditions generated in this experiment are not unusual.
Time-Delayed Initial Condition
Even though it is an artificial device, not called for in Darcy-Richards modeling or basic unsaturated zone flow theory, the use of a water content profile measured at a time τ after the start of infiltration can have appreciable value when used as a surrogate for the initial profile. This substitution markedly improves model simulations both for the remainder of the infiltration period and the 76-day redistribution period. Unlike the other alterations of the model application we tested, this one is actually a retreat from realism, as the IC being used is not the one that actually existed at the start of the infiltration experiment. Another way to look at it is to say that if we simply do not try to model the first few hours during infiltration, but only the period after that time, a Darcy-Richards model can give reasonable predictions. The improvement in model results with a time-delay IC is evidence of the shortcomings of accepted theory or its typical implementation.
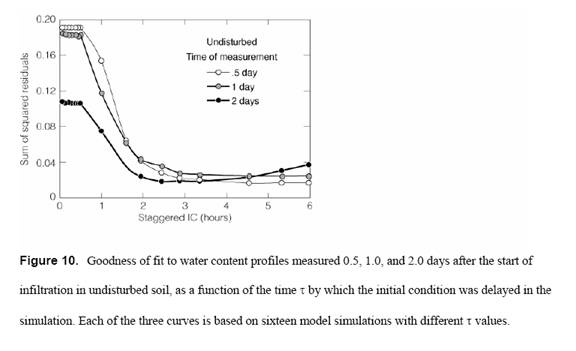
To evaluate the possible ideal value of τ, we computed model results for a range of τ and compared the results with measurements. Goodness of fit, computed as the sum of squared residuals between modeled and measured results, is graphed in Figure 10 as a function of τ. Fit quality improves with increasing τ up to about 2 hr. Beyond τ = 3 hr there is no significant further improvement. For this soil under these conditions, 3 hr appears to be the optimum interval by which to delay the IC. The optimum may vary with soil type, mechanical treatment, texture, and other factors not tested here.
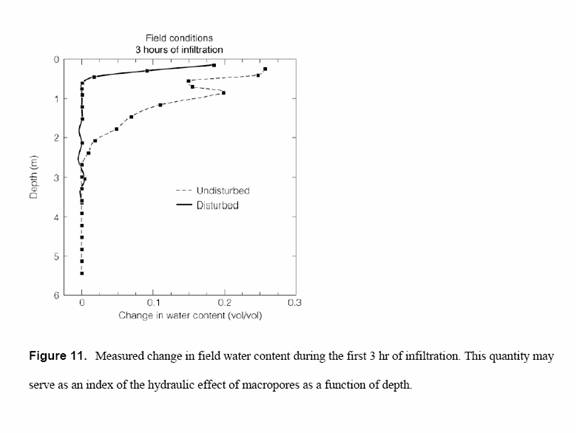
These results suggest that macropores may have essentially all their influence during the first few hours of ponded infiltration. One could interpret this as the time during which macropores are hydraulically active. This concept is qualitatively the same as the two-stage water movement described by Quisenberry and Phillips (1976), who mentioned 1 hr as the time interval during which macropore flow takes place. Mathematically, the change in θ profile during such an initial interval appears to contain the information needed to quantify effective macropore properties, and to account for macropore flow, even 11 weeks later. Thus the difference in θ profiles between 0 and τ could be used as an index of macropore effects on flow. Figure 11 shows this index plotted with depth for the disturbed and undisturbed profiles. In both cases it strongly declines with depth. This observation is consistent with the expectation that macropore abundance would decline with depth. Except at the shallowest and deepest depths, this index is greater for undisturbed soil, again consistent with the expected abundance of macropores and with the greater deviation between measured results and Darcy-Richards model predictions. Even in the disturbed soil the index has a large magnitude very near the surface, where it is likely that weathering and biological influences have significantly altered the soil structure during the eight years since the construction of the simulated waste trench.
Recharging Fluxes
Because moisture conditions in the undisturbed soil below 2 m appear unperturbed by the artificial flood, it is possible on the basis of available data to estimate long-term average fluxes, which likely represent aquifer recharge, below this depth (Nimmo et al., 1994). The unchanging character of the θ profile below 2 m makes it reasonable to assume a negligible matric potential gradient, and therefore that flow here is driven by gravity alone. Measured K values at the water content here, about 0.28, can give a direct estimate of the long-term average recharge rate. SSC measurements on the sample from 224 cm depth suggest a K at this water content of about 1 × 10-11 m/s or 0.3 mm/yr. Lab-measured K values by the one-step outflow method at 3.4 m depth range from 2 × 10-12 to 7 × 10-11 m/s for the range of water content present below 2 m. The extremes of this range suggest the long-term average gravity-driven flow falls between 0.06 and 2 mm/yr. The geometric average of about 1 × 10-11 m/s would indicate 0.3 mm/yr, in agreement with the estimate from the more accurate SSC method. The great sensitivity of K to θ at these low θ values means that the uncertainty of this estimate is greater than suggested by the 0.06-to-2-mm/yr range. This evidence as a whole suggests the average downward flow at 2-4 m depth is probably less than 2 mm/yr. This might be indicative of natural recharge because this is an undisturbed profile that has not been exposed to major artificial deviations from the natural, semi-arid climatic and hydrologic conditions. This estimate is less than the recharge range of 3.6 to 11 mm/yr estimated for this site by Cecil et al. (1992) using the depth of the peak concentration of bomb-test fallout tracers. The estimates of Cecil et al., however, use the assumption that the tracers moved to the depths of measured peak concentration, 1.3 to 1.65 m, at a constant rate over the three decades since the bomb tests. A problem inherent in this tracer-method assumption is that the tracer probably moved downward faster at first, likely covering a large fraction of the total travel distance, perhaps the entire root zone, during the first few years. For this reason a tracer method of this type is likely to overestimate the average deep-unsaturated zone flux, and it is not surprising that an estimate based on measured K would suggest a lower flux. More recent flux estimates of Cecil (private communication, May 12, 2004) by the chloride mass-balance method suggest recharge rates about an order of magnitude lower than the bomb-tracer estimates, in closer agreement with our results.
The measured loss of water during redistribution from the 0-2 m interval of the undisturbed soil can be compared with this downward flux estimate. If flow is downward this water loss would represent a flux density of 5 × 10⁻⁸ m/s averaged over the first 32 d of neutron measurements, and 5 × 10⁻⁹ m/s for the period between 32 and 76 d. Because this greatly exceeds the estimated flux below 2 m, a different mechanism must be diverting water from deeper depths, probably lateral flow.
A comparable situation is not apparent in the disturbed soil, where moisture conditions seem to be transient throughout the zone of neutron measurements. For example, neutron measurements at 2 m depth for the period between 10 and 32 d indicate a transient flux density of 1 × 10⁻⁸ m/s (300 mm/yr). With the lack of flow steadiness at this depth, this result is not a long-term recharge rate, though it may be representative of water flow in response to snowmelt or local flooding.
Conclusions
Landfill construction by excavating and replacing soil destroys macropores and homogenizes layers, and has a great effect on unsaturated flow. With infiltration and redistribution from an artificial flood, there is essentially simultaneous wetting throughout a 2-m thickness of undisturbed soil, but a sharp wetting front in the disturbed soil of a simulated waste trench. There also is an effective blockage of downward movement of water at 2 m depth in the undisturbed soil, but no such blockage in the disturbed soil. Numerical simulation with a Darcy-Richards-based code such as VS2DT can work reasonably well for the disturbed (though not the undisturbed) soil, especially if Ksat and θmax are determined by inverse calculations using field profile data. These distinctions suggest that both preferential flow in macropores and flow retardation due to layering are important in the undisturbed medium. The retarding effects of layers are highly effective even though preferential flow is strongly evidenced. In terms of effect on fluxes in the deep unsaturated zone, reduced preferential flow in a landfill may be more than compensated for by the loss of natural layering. For the site and conditions tested, the macropores exert their influence on redistribution of water mainly during the first three hours of infiltration. The change in θ during this time interval, as a function of depth, has value for predicting unsaturated flow for several weeks after infiltration ceases. It effectively represents a quantification of macropores (or of a general propensity for preferential flow) that may be useful as a practical index, and may lead to more realistic modeling of long-term flow behavior.
The influence of mechanical disturbance, however, is not so apparent in measured hydraulic properties. Field and laboratory measurements by standard techniques give a consistent picture of pro-nounced layering of the undisturbed medium that is absent in the simulated waste trench, but mostly do not reflect the effects of macropores. Hydraulic-property measurements typically lack good data at high water contents, between about 85 and 100% of saturation, a range likely to be important in quantifying downward flow at the surface. Standard measurements of K(θ) and θ(ψ) do not contain the information needed to understand all significant behavior of infiltrated water.
For aquifer-recharging fluxes through an undisturbed soil profile, the treatment of preferential flow and impeding layers is more important than the degree of realism in routine soil characterizations such as knowledge of water retention and hydraulic conductivity, resolution of layers, and the modeling of more than one dimension. Estimation of long-term average recharging fluxes can be made more reliably in undisturbed than in disturbed soil. Estimation of transient fluxes likely to become recharge, based on downward fluxes below 2 m depth in a short-term response to substantial infiltration, are much greater in disturbed soil than in undisturbed soil. Concerning the influence of soil disturbance for conditions like those tested here, this result suggests that the recharge-increasing effect of layer-contrast destruction dominates the recharge-reducing effect of macropore destruction.
Acknowledgements
We are indebted to several scientists who contributed especially to the early stages of this research. John R. Pittman and Jon F. Kaminsky conducted the undisturbed-soil field experiment. Stephanie M. Shakofsky conducted most of the lab measurements, the disturbed-soil field experiment and the one-dimensional numerical modeling. Gary S. Lords made critical contributions in sample collection and field experiments. Michelle A. Denton did most of the two-dimensional and hysteretic numerical modeling.
References
[1]
Allmaras RR, Rickman RW, Ekin LG, Kimball BA (1977) Chiseling influences
on soil hydraulic properties. Soil Science Society of
[2]
Allmaras RR, Ward K, Douglas CL, Ekin LG (1982) Long-term cultivation
effects on hydraulic properties of a
[3]
Andraski BJ (1996) Properties and variability of soil and trench fill at
an arid waste-burial site. Soil Science Society of
[4]
Azooz RH, Arshad MA, Franzluebbers AJ (1996) Pore Size Distribution and
Hydraulic Conductivity Affected by Tillage in Northwestern
Canada. Soil Science Society of
[5]
Bartholomay RC, Knobel LL, Davis LC (1989) Mineralogy and grain size of
surficial sediment from the Big Lost River
drainage and vicinity, with chemical and physical characteristics of geologic
materials from selected sites at the Idaho National Engineering Laboratory,
[6] Basile A, Ciollaro G, Coppola A (2003) Hysteresis in soil water characteristics as a key to interpreting comparisons of laboratory and field measured hydraulic properties. Water Resources Research 39(12). 1355. doi:10.1029/2003WR002432.
[7]
Bouma J, van Rooyen DJ, Hole FD (1975) Estimation of comparative water
transmission in two pairs of adjacent virgin and cultivated pedons in
[8]
Cecil LD, Pittman JR, Beasley TM, Michel RL, Kubik PW, Sharma P, Fehn U,
Gove HE (1992) Water infiltration rates in the unsaturated zone at the Idaho
National Engineering Laboratory estimated from chlorine-36 and tritium
profiles, and neutron logging. In: Kharaka Y and Maest A (eds) Water Rock Interaction.
Balkema,
[9]
Chertkov VY, Ravina I (1998) Modeling the crack network of swelling clay
soils. Soil Science Society of
[10] Constantz J, Herkelrath WN (1984) Submersible pressure outflow cell for measurement of soil water retention and diffusivity from 5 to 950 C. Soil Science Society of America Journal 48(1):7-10.
[11] Davis LC, Pittman JR (1990) Hydrological, meteorological, and geohydrological data for an unsaturated zone study near the Radioactive Waste Management Complex, Idaho National Engineering
[12]
Laboratory,
[13] Doherty J, Brebber L, Whyte P (1994) PEST--Model-independent parameter estimation. Watermark Computing.
[14]
Dunker RE, Hooks CL, Vance SL, Darmody RG (1995) Deep tillage effects on
compacted surface-mined land. Soil Science Society of
[15]
Gardner WR (1956) Calculation of capillary conductivity by the one-step
method. Soil Science Society of
[16]
Gee GW, Bauer A, Decker RS (1978) Physical analyses of overburden
materials and mine land soils. In: Schaller FW and Sutton P (eds) Reclamation
of Drastically Disturbed Lands. 1st ed. American Society of Agronomy,
[17] Hamblin AP, Tennant D (1981) The Influence of Tillage on Soil Water Behavior. Soil Science 132(3):233-339.
[18]
Healy RW (1990) Simulation of solute transport in variably saturated
porous media with supplemental information on modifications to the U.S.
Geological Survey's computer program VS2D.
[19] Jayawardane NS, Prathapar SA (1992) Effect of soil loosening on the hydraulic properties of a duplex soil. Australian Journal of Soil Research 30:959-975.
[20]
Johnson CD, Skousen JG (1995) Minesoil properties of 15 abandoned mine
land sites in
[21]
[22]
Kaminsky JF (1991) In situ characterization of unsaturated hydraulic
properties of surficial sediments adjacent to the radioactive waste management
complex, Idaho National Engineering Laboratory,
[23]
Klute A (1982) Tillage effects on the hydraulic properties of soil--A
review. In: Unger PW and Van Doren DM, Jr. (eds) Predicting tillage effects on
soil physical properties and processes. American Society of Agronomy,
[24]
Klute A, Dirksen C (1986) Hydraulic conductivity and diffusivity,
laboratory methods. In: Klute A (ed) Methods of soil analysis, Part I. Soil
Science Society of America,
[25] Lappala EG, Healy RW, Weeks EP (1987) Documentation of computer program VS2D to solve the
[26] inl.soildisturbrecharge.ms.9.doc 2006-07-28 30
[27]
equations of fluid flow in variably saturated porous media.
[28]
Leummens H, Bouma J, Booltink HWG (1995) Interpreting differences among
hydraulic parameters for different soil series by functional characterization.
Soil Science Society of
[29]
Miller DE, Gardner WH (1962) Water infiltration into stratified soil. Soil
Science Society of
[30]
Mitchell AR, van
[31]
Nimmo JR (1992) Semiempirical model of soil water hysteresis. Soil Science
Society of
[32]
Nimmo JR, Stonestrom DA, Akstin KC (1994) The feasibility of recharge rate
determinations using the steady-state centrifuge method. Soil Science Society
of
[33]
Nimmo JR, Shakofsky SM, Kaminsky JF, Lords GS (1999) Laboratory and field
hydrologic characterization of the shallow subsurface at an Idaho National
Engineering and Environmental Laboratory waste-disposal site.
[34]
Nimmo JR,
[35] Passioura JB (1977) Determining Soil Water Diffusivities from One-Step Outflow Experiments. Australian Journal of Soil Research 15(1):1-8.
[36]
[37]
Perkins KS
(2000) Hydrologic and meteorological data for an unsaturated-zone study area
near the Radioactive Waste Management Complex, Idaho National Engineering and
Environmental Laboratory,
[38]
[39]
influence near the Idaho Nuclear Technology and
[40]
Pittman JR (1989) Hydrological and meteorological data for an unsaturated
zone study near the Radioactive Waste Management Complex, Idaho National
Engineering Laboratory,
[41]
Pittman JR (1995) Hydrological and meteorological data for an
unsaturated-zone study area near the Radioactive Waste Management Complex,
Idaho National Engineering Laboratory,
[42]
Quisenberry VL, Phillips RE (1976) Percolation of surface-applied water in
the field. Soil Science Society of
[43]
Quisenberry VL, Phillips RE (1978) Displacement of soil water by simulated
rainfall. Soil Science Society of
[44] Richards LA (1931) Capillary conduction of liquids through porous materials. Physics 1:318-333.
[45]
Rightmire CT, Lewis BD (1987) Hydrogeology and geochemistry of the
unsaturated zone, Radioactive Waste Management Complex, Idaho National
Engineering Laboratory, Idaho.
[46]
Shakofsky SM (1993) Changes in the hydraulic properties of a soil caused
by construction of a waste trench at a radioactive waste disposal site. M.S.
thesis,
[47]
Shakofsky SM (1995) Changes in soil hydraulic properties caused by
construction of a simulated waste trench at the Idaho National Engineering
Laboratory,
[48] Shakofsky SM, Nimmo JR (1996) Unsaturated zone properties at a waste disposal site at the Idaho National Engineering Laboratory. In: Morganwalp DW and Aronson DA (eds) U.S. Geological Survey Toxic Substances Hydrology Program--Proceedings of the Technical Meeting, Colorado Springs, Colorado September 20-24, 1993: U.S. Geological Survey Water-Resources Investigations Report 94-4015. p. 949-953.
[49] Tokunaga TK, Wan J, Olson KR (2002) Saturation-matric potential relations in gravel. Water Resources Research 38(10). 1214. doi:10.1029/2001WR001242.
[50] van
Table 1. Average effective lab-measured θmax for each of 9 layers.