


Achievements
RESEARCH ON THE WATER ENVIRONMENT EARLY WARNING IN WEST OF SONGNEN PLAIN
Tang Jie Bian
Jianmin Lin Nianfeng Yang Jianqiang
(College of Environment and
Resources, Jilin University, Changchun 130026, China)
Abstract: Groundwater table
changes might exert on the environment, the coupling technology with GIS and
PModflow had been used to define the warning threshold of the groundwater
environment early warning in the paper. By the means, the phreatic water table
with no-salinization had been defined to be the maximum limit, and the pumping
limit of the phreatic water been defined as the minimum limit. On the basis of
system model generalization, water table had been simulated and predicted. The
spatial analysis of GIS was used to overlay the grid and attributes judgment,
and the water environment early warning had been finished through the
comparison of the predicted water and the water table warning limit. Results
showed that the early warning state in 2015a was heavier than 1999a,
and the secondary salinization was the main case due to the phreatic water
table uplift.
Keywords:GIS; PModflow;
phreatic water table; water environment early warning; numerical simulation;
integrated system
1 Foreword
The concept of
early warning was initially applied to radar technique and missile defense
system in military affairs, and was widely used in flood forecast, economy
system, weather and environment engineering disaster prevention and so on
recently. But the research and application in the field of resources and
environmental science was relatively less, and it was seldom found in the study
literature on water resource environment early warning at present[1-4].
The western
Songnen plain was wide, and belonged to semi-arid and semi-humid continental
monsoonal climate. The average annual rainfall was 400-500mm, of which the rain
from June to September occupied the 74-84 percent. The average annual
evaporation increased from the east to the west, which was from 1400
to 2100mm. There were abundant resources of water, soil, living things and
oil in the area, and it was important base of agriculture, herd and energy
sources. There were few rivers in the area which distributed unevenly, and the
noncontributing area was large. There was lack of surface water in the area and
relatively rich in the groundwater. In recent years, reservoirs built in the
upstream intercepted the streamflow. The capacity of Tao’er
River, Huolin River and Jiaoliu River decreased
even resulted in the dry strand, and the groundwater recharge reduced as well.
Under the double influence of global warming and intense exploitation, the
eco-environment deteriorated rapidly, and it was serious that the short of
water resources, soil salinization and degradation. Drought, soil salinization
and regional water level depression had been the main problems in the area. In
the recent years, Chinese Academy of Sciences, colleges and manufacture
branches have carried out a great deal of scientific researches and productive
practices, which offered to the reasonable exploitation of water resource and
the integrate remedy of the eco-environment. However, it was the first time in
studying the water resources early warning from the point of view of water
level amplitude.
It was adopted
that the GIS-Modflow integrated system in the paper[5,6].
By the generalization of the hydro-geology condition, the numerical model about
the phreatic water flow was built up. As to the P-Modflow software and Method
of Finite Difference (MFD), numerical simulation and prediction was done on
phreatic water flow to open out the transport mechanism and forecast it. On the
GIS flat roof, through the comparing operation of water level status in quo to
guard line, based on which, early warning was done to the water environment.
2 Early warning
threshold determination
|
|

|
There is high in
east, south and west, and low in north in the area, which made it a
water-bearing basin like a dustpan. The ground water had a wide gathering area,
and flush recharge sources, which include precipitation
and Huolin River backward dispersion, and the lateral recharge
of mountain groundwater and river. There were groundwater lateral recharges in
the northwest mountainous area, Changling-Songliao watershed, and high plain.
The groundwater was recharged along the run off of Tao’er River
and Jiaoliu River in the middle reaches and upstream area, and
was supplied from partial surface water
of Songhua River and Nen River at flood season as
well.

|
|
|
Warning limit confirmation Key to water environment early
warning was to determine the warning limit. Whereas the phreatic water was
nearly contacted to environment, the phreatic water level amplitude was chosen
to be the main study object. The phreatic water table with no-salinization had
been defined to be the maximum limit, and the pumping limit of the phreatic
water been defined as the minimum limit. By the long term observation and
integrated study, the deepest exploitation of the phreatic water was half of
the thickness of it from the surface, and any exploitation exceed would result
in the depletion of the water resources.
The western of
Songnen plain was wide, with complex and varied land form styles, soil
structure and hydro-geology conditions, it was quite difficult to obtain the
phreatic critical depth in the whole area. Therefore, the concept of reasonable
phreatic depth was brought forward for protecting salt accumulation in soil.
That is, the phreatic water level should be within the changing range to control
the soil salinization in a relatively low value. Based on the phreatic water
level in 1996, geodynamics model for inversion[9] was used to
solve the reasonable phreatic water level.

|
Based on the
geodynamics theory, to confirm the influence of the nature and human being to
the groundwater system, it should be considered as followings, the increase of
the output factors of the groundwater dynamics was produced by the increase of
factors input and the artificial influence to the groundwater system, where the
increase may be negative.
Where: Y-value of
the phreatic water level, -changes of the
phreatic water level;
M-the influence
degree of human activities, soil salinization degree in the paper, -contribution
degree of the human activities;
K1 -
influence intensity coefficient.

|
Based on the data
of phreatic water level in 1983 and 1996, and the RS interpreted data of soil
salinization in 1983 and 1995, using the overlay and analysis functions in GIS,
the grid maps were formed that the influnce intensity of phreatic water level
to soil salinization by the overlay of the two maps under nature and human
activities (omited). By the overlay analysis and the calculation of the maps of
soil styles, soil salinization, and groundwater phreatic water level, it was
discovered that as to the influence coefficient of phreatic water level to soil
salinization, the area of more than 0.5 was 10.28% of the whole calculated
area, and 0.3-0.5 was 12.77%, where there was the most serious salinization.
Supposed that the increase of soil salinization was controlled at 1%, that is,
the soil salinization of each unit was increased by 1%, the relation between
phreatic water level and soil salinization was as following formula.
That is to say,
the units reached 50% or 30% of all that the influence intensity coefficient
with more than 0.5-0.3.
Where:
H1:phreatic water level in 1996
H2:phreatic water level in 2015
M1:soil salinization in 1996
M2 :soil salinization in 2015
If H1,
M2 and M1were known, H2 could be calculated
from the formula (2).
According to the analysis of the RS interpret data of the area, the soil
salinization increased at rate of 2.61%/a in the twelve years of 1989-2001. To
protect the eco-environment and hold down the development of soil salinization,
the aggravated speed should be kept at rate of 1% in the area, and the H2 was
the controlled phreatic water level in 2015 under the condition. Based on H2,
it was drew that the early warning maximum limit map using GIS based on the H2 value
in the units, shown as fig. 1.
3 Water table
forecast model foundation
3.1 Generalization
of the system model
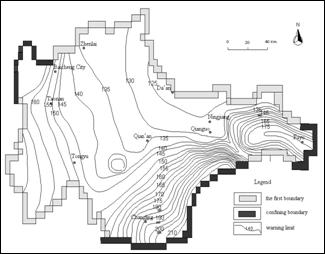
Fig.1 The upper
water table threshold of the early warning in west of Songnen Plain
(1)Spatial
distribution of the aquifer
The phreatic
aquifer in the area were divided into: ①Porous phreatic aquifer of sloping plain in front of western mountains,
which comprised of sandy pebble gravel and cobble of mid Pleistocene series and
upper Pleistocene series, with coarse grain and pole-strength conductivity (K=140-300m/d); ② Porous phreatic aquifer in valley
plain, eastern high plain and in the middle of the Huolin River, which
comprised sand and sandy gravel, with relatively strong conductivity (K=10-100m/d); ③ Porous phreatic aquifer in the area
between Songhua and Lalin River, and in the western low plain, which comprised
fine sand, middle and powdery fine sand, with relatively weak conductivity (K=10-20m/d); ④ Porous phreatic aquifer in the middle
of the low plain as Qian’an and Da’an district, which mostly comprised loess
sub-sandy soil, powdery fine sand and sub-sandy soil, with quite fine grain and
very bad conductivity (K=3-10m/d). The conceptual model of the hydrogeology in the area was shown
in Fig. 2, where illustrated the distribution of the boundary, the character,
the zone of the hydrogeology conductivity and the distribution of the
observation wells.
(2) Generalization
of the lateral boundary
The Tao’er river
alluvial-proluvial fan in the northwest of the calculated area was adjourn to
the bedrock mountain area which was mainly lava and with quite low
conductivity, so it was generalized to be the confining boundary. The Tao’er
and Jiaoliu River valley with perennial water were considered to
be runoff boundary. Using the runoff information of the upstream and lower
river and the water level contour, after integrated analysis, the transform
from surface water to groundwater was calculated based on the water balance
relation. As to the south and the east, the boundary was generalized to be
confined for the watershed of the groundwater. In the northeast, there was the
Nen, Songhua, lalin and secondly Songhua River, where were all
drainage boundary, and could be generalized to be first boundary, that is,
known water head boundary. In addition to the above boundaries, there were lots
of water level observation wells at other boundary areas, where could be
generalized to be first boundary with known water head.
(3)Generalization
of the vertical boundary
Based on the dynamic changing information of the phreatic water level, the
phreatic changes was influenced by the manual exploitation, phreatic
evaporation, and the infiltration of precipitation, irrigation, and of the
river bed, so the upper boundary was the water exchange boundary. The lower
boundary was divided into two kinds of conditions, one was at single phreatic
aquifer as the porous-phreatic area in alluvial-proluvial fan and the valley
plain, where the lower boundary was relatively confined and was generalized as
confining boundary, the other was double layer aquifer, which was upper pore
phreatic water and lower pore confined water, and the vertical boundary was
belong to the discharge boundary of Daqinggou group with a feeble leakage
aquifer.

Fig.2 Groundwater
hydrogeological conceptual model in west of Songnen
3.2 Numerical
model foundation
Based on the
hydrogeology conceptual model above, numerical model of the phreatic flow was
built up as following.

Where: -hydraulic
conductivity (m/d),
-hydraulic
conductivity (m/d),  -specific yield of
the phreatic aquifer;
-specific yield of
the phreatic aquifer;
H,H0-groundwater
level, phreatic water (m); B-bottom of the aquifer (m);
Qr-infiltration
intensity (m/d); Qd –drainage intensity
(include pumpage)
(m/d);
Qi-well
exploitation (m3/d); h0-initial head (m); h1-water
level of first boundary (m); q-unit wide flux of secondary boundary;
x,y-coordinate (m); D-calculated area;  - first and second
boundary;
- first and second
boundary;
 -inner normal line
in the boundary; n-total wells number.
-inner normal line
in the boundary; n-total wells number.
3.3 Solution
to the model
Traditional
quadrilateral dividing was selected to divide the calculated area into one
layer, 38 rows, 70 columns, and 2660 units. There were 149 confirmed water head
units, 753 invalidating calculated units, and 1408 water head changing units
(efficient calculated units). The unit size should be consistent to the size of
grid unit of the guard line. The calculated area was 35201.17km2,
which was 74.77% of the western Songnen plain, and the average unit area
was 25km2. Spaces between rows and columns were all 5000m,
and the thickness was fixed by the specific condition.
3.4 Identification
and validation of the model
Compared the water
head of calculated to that of the observed, the relevent hydrogeology
parameters were obtained in reversion. The identification time was from Oct. 15th,
1996 to March 30th, 1997, and the time step was 15d, with 11 periods
of time. There were few recharges and drainages, and the groundwater was in
normal year, so it was easy to calculate.
The parameter zone
of calculated model on phreatic aquifer was basically according to the
hydrogeology ranges of the area. The initial value of the parameters was
confirmed by the pumping tests results in the perambulation and study periods.
To identify the model in winter, there was no recharge from precipitation and
irrigation, and the phreatic water evaporation could be omitted. The sink and
source from leakages, rivers and lakes could be added into corresponding
calculated units, and the domestic water for cities was distributed to the
units by intensity.
At last, the
sink/source and initial heads were input into the numerical model, and matched
the hydrogeology parameter until the fit error between the calculated and
observed water level reached the demand at the end of the run time. The
validation indicated that the units with error of fit less
than 0.5m were over 70% of the whole, which showed that the
hydrogeology conceptual model and the numerical model were all reliable.
To validate the
reliability, it was tested that the regional numerical model built. The lower
water level period (Mar. 11 to May 11, 1997, that is, 61d) and water table
ascending period (May 11 to Aug. 11, 1997, that is, 92) were chosen as the
validated period of time. The lower water level was taken to draw the initial
head and the sink/source of the different period of time, input and calculated the
water level at the end time. The validated error of fit the calculated and the
observation water level of the two period of time indicated that the units with
error of fit less than 0.5m were over 73% of the whole, and the
numerical model could be used to the groundwater forecast.
3.5 Phreatic
water level forecast
According to the
future program project of the study area, the water level time was confirmed
as 15a, that’s 1999-2015. As the dynamic observation information of the
groundwater was relatively complete in May, 1999, and there were many
observation wells then, it was made to be the basic value of the forecast that
the phreatic water level at that time.
(1) Boundary
and sink/source
The precipitation
was the main recharge resource of the groundwater. The Monte-Carlo method was
selected to the forecast in the research work. Ten lasting observation wells of
the first boundary were chosen to set up the head-time relation formula, which
showed that the validating correlation results were all obvious. Other boundary
wells were given by interpolation method. The sink/source forecast of the
phreatic water model was designed according to the water with program of the
different industry and the water conservancy program, at the same time, the
forecast was ran based on the correlation equation between the source-sink and
the easy confirmed variance as time or else. For example, the correlation
between river and groundwater was confirmed by correlated model of river
leakage with precipitation and runoff.
(2)Forecast
results and analysis
The forecast results (Fig. 3) showed that the phreatic water flow changed
little till 2015, no matter from the whole shape or the direction of the
groundwater flow. The water table draw down relatively little, the maximum value
was less than 5.5m. During the forecast period, the phreatic water head
changed slightly along with the precipitation. At the alluvial-proluvial fan in
Baicheng, where had strong pumping rate, the water level descended continually
with small amplitue, the average draw down was 0.25m/a. At paddy field
area in Qianguo county and Zhenlai county, where took surface water as the
source, phreatic water level ascended a little for the infiltration recharge of
the irrigation water. For example, the phreatic water head of 143# and 210# had
ascended for 12 years in the 15 years. The result indicated that the
exploitation of the paddy field could increase the phreatic water recharge, and
the salinization risk would emerge along with the ascending of the phreatic water
head.
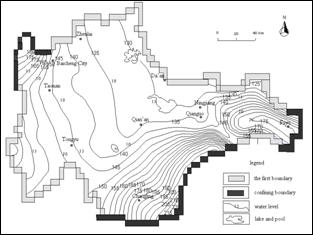
Fig.3 The
forecast of water table of the early warning in the west of Songnen
4 Phreatic Water
Level Early Warning
Based on the water table forecast, calculated the water level of status in
quo and of the forecast, and compared them to the warning limit to fulfill the
early warning. GIS spatial analysis was used to do the grid map overlay and the
attribute judgment, in which multilayer grid data composition was adopted, such
as arithmetic operation and vector polygon overlay analysis. MapInfo was used
to deal with the layers into grid map as threshold, phreatic water flow of
status in present and of forecast, and do the early warning judgement. The data
beyond the upper and lower warning limit were divided into different warning
value and the warning condition. The results were shown in Tab. 1 and Fig. 4.
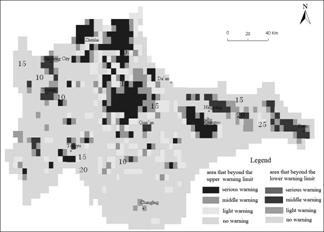
Fig.4 Grid map of early warning on water
environment in west of Songnen Plain in 2015a
Tab.1 Early warning Result of the phreatic water table
|
Warning grade |
Warning values (m) |
1999年 |
2015年 |
|||
|
Area (km2) |
Percent
of the
total (%) |
Area (km2) |
Percent
of the
total (%) |
|||
|
Beyond the upper
warning limit |
Serious |
³1.00 |
2536 |
7.20 |
3468 |
9.85 |
|
Middle |
0.50~1.00 |
1838 |
5.22 |
2365 |
6.72 |
|
|
Light |
0.00~0.50 |
4174 |
11.86 |
3913 |
11.12 |
|
|
Subtotal |
8548 |
24.28 |
9746 |
27.69 |
||
|
Beyond the lower warning
limit |
Serious |
³2.00 |
|
|
|
|
|
Middle |
1.00~2.00 |
1324 |
3.76 |
1503 |
4.27 |
|
|
Light |
0.00~1.00 |
1193 |
3.39 |
1419 |
4.03 |
|
|
Subtotal |
|
2517 |
7.15 |
2922 |
8.3 |
|
|
Within warning limits |
No warning |
|
24136 |
68.57 |
22533 |
64.01 |
Other warning
areas were in district of Qian’an, Tongyu and the southwest of Da’an. The topography
in the area was relatively low, and there were many dishing closed billabong,
marsh and low plain, so the drainage was hintered after irrigation, and
resulted in the phreatic water level ascended and secondary salinization. The
area with warning value beyond the lower warning limit were mainly distributed
in the plot between Songhua River and Lalin River, and in western sloping plain
in front of the mountains, where the water resources were relatively rich and
high exploited. The phreatic water level was higher than the confined water
table in most of the area between Songhua and Lalin River. Under the
influence of the manual exploitation on pore confined water, the phreatic water
supplied the confined one, and it would be much more evident when the confined
water was exploited largely. Together with the water table dropped down beyond
the lower warning limit, the phreatic water were also supplied the confined
aquifer in western sloping plain in front of the mountains. In the recent
years, the climate in the area was gradually drying, precipitation was reduced,
and the groundwater recharge resources reduced obviously. At the same time, the
exploitation on the groundwater increased year by year, which resulted in the
continually lowering of the water head even beyond the lower warning limit.
5 Conclusions
Water resources
early warning was a new research subject, which involved many new theories and
methods. It was important to define the early warning object and to confirm the
warning limits on the groundwater environment early warning, which was a new
search by GIS-PModflow system.
The results showed
that there were warnings of both secondary soil salinization and local water
table descending. The former was caused by water level ascended from irrigation,
and the latter was caused by the heavy exploitation. So it was essential to
exploit groundwater resource rationally, which was the important base to ensure
the sustainable development of the economy and environment in the area.
The water
environment system was rather complex and involved many influenced factors.
Under the control of physical geography, hydrology and artificial factors, the
early warning objects were different obviously in specific areas. So it was
essential to have deeply studies in such problems as environment character,
early warning object, foundation of warning index system, technique and method
of early warning and so on. GIS-PModflow integrated system was adopted in the
paper and useful experiments was done on water environment early warning in
western Songnen plain. The method was predominant in numerical simulating,
forecasting and early warning analysis judging of the phreatic water level,
still with the warning limit confirming, and it would be a new research
direction in the water environment study field.
References
[1] Fu Bojie. Study on the Theory and Application of Regional
Eco-Environment Early Warning. Chinese Jounal of Applied Ecology. 1990, 4(4):
436-439.
[2] Xu Xuegong. Study on Evaluation and Pre-Warning of Ecological Environment in the Yellow River Delta. Acta Ecologica Sinica. 1996, 16(5): 461-468.
[3] Chen Guojie. An Approach on Environmental
Warning. Chongqing Environmental Science. 1996, 18(5): 1-4.
[4] Chen Zhijian, Chen Guojie. Study on Early Warning System on
Environment Impress estimation. Environmental Science.1992,13(4): 20-24.
[5] Lin Nianfeng, Tang Jie. The Functions of Combined System EIS-GIS and
Its Significance in Quaternary Studies. Quaternary Sciences. 2001, 21(2):
100-107.
[6] Lin Nianfeng Tang Jie. The Effect and Signification of GIS and EIS on
the Research of Environmental Geology. Soil and Environmental Sciences. 2000,
9(4): 259-262.
[7] He Yanbo, Yangkun. Remote Sensing and Geographic Information System
Apllied to Hydrologic Modeling. Geology geochemistry. 1999, 27(2): 99-103.
[8] Yin Kuihao, Weng Lida. Application of GIS in Water Resource
Development, Utilization, and Protection. Water Resources Protection. 1999,
(1): 10-14.
[9] Fan Shengyue, Xu Jianhua. Normal Numerical Model on Human Activity
Effect Analysis to Water and Soil Loss and Desertification System. Scientia
Giographica Sinica. 1992, 12(4): 305-307.
[10] Wang Zhanxing, Xiu Qingshan, Lin Shaozhi, et al. Groundwater and
Quaternary Geology at Baicheng Area. GeologyExpert Report(6) Hydrogeology and
Engineering Geology(No. 3). Beijing: Geology Publishing House. 1992
[11] WeiWenqiu, YuJianying. Application of GIS to Hydrology and Water
Resources Management. Advances in Water Science. 1997, (3): 296-300.
[12] LiuYong,JingWenyong. GIS Technology and Its Applications in
Environmental Sciences and Engineering. Environmental Science. 1997, 18(2):
62-65.