


Achievements
SATELLITE BASED DAILY EVAPOTRANSPIRATION IN HEBEI PLAIN, NORTHEASTERN CHINA
Wenjing Lin
Institute of
Hydrogeology and Environmental Geology, Shijiazhuang, P.R.China
Z. Su, Rogier van der Velde, Xin Shan
International
Institute for Geo-information Science and Earth Observation
(ITC), Enschede, Netherlands
Abstract: Evapotranspiration is one of the
most significant components of the hydrologic budget. Conventional techniques
that based on the point measurements are representative only of local scales
and will fail for large scales. Satellite sensors that observe the earth from
the space give a chance to estimate evapotranspiration in a big scale. The
Surface Energy Balance System (SEBS) model was developed to estimate land
surface fluxes using remotely sensed data and available meteorological
observations. It has the most important advantage of its inclusion of the a
physical model for the estimation of the roughness height for heat transfer
which is the most critical parameter in the parameterization of the heat fluxes
of land surface. In this paper, SEBS has been utilized to estimate the surface
fluxes over Hebei Plain in Northeastern China by using MODIS/TERRA
images, in combination of meteorological data collected in meteorological
stations distributed over the study area. The estimated daily
evapotranspiration by SEBS are first compared with measurements by large
weighing lysimeter in Luancheng Agro-Ecosystem Station (LAES) located
near Shijiazhuang city. The comparisons show that the estimated
evapotranspiration from SEBS have a good agreement with the ground truth data.
Based on the validation of the model, the spatial-temporal distributions of
actual evapotranspiration were analyzed in combination of the up-to-date land
cover map in Hebei Plain.
Keywords: Evapotranspiration, SEBS,
MODIS/TERRA, Hebei Plain
1 Introduction
Apart from precipitation, the most significant component of the
hydrologic budget is evapotranspiration. Evapotranspiration varies regionally
and seasonally according to ambient environmental conditions, such as
climate condition, land cover, land use, soil moisture, and available radiation
etc. Because of this variability, research for integrate water resources
modelling, dynamic crop-weather modelling and drought monitoring, a thorough
understanding of the evapotranspiration process and knowledge about the spatial
evapotranspiration is needed.
In the last few decades the theoretical and
applied analysis of evapotranspiration and its components transpiration and evaporation
have received much attentions. A physically based equation for potential
evapotranspiration (ET0) was derived by Penman by combining energy
balance equation with the aerodynamic equation for vapour transfer(Penman 1947;
Penman 1956). It was subsequently modified by Monteith to include a canopy
resistance for vapour diffusion out of stomata. Apart from above mentioned
principles, there are many other methods that have been proposed for estimating
ET0. By comparing 20 different methods of estimating ET0, Jensen et
al. showed that the Penman-Monteith equation provide the best accurate estimate
of evaporation from well-watered grass or alfalfa under varied climate
conditions(Jensen, Burman et al., 1990). However, these
conventional techniques are based on the point measurements and are
representative only of local scales and will fail for large scales because of
the dynamic nature and regional variation of ET. On the other hands,
Penman-Monteith equation provided only an estimation of the potential ET, which
limits its use in practical applications.
Evaporation of water requires relatively large amounts of energy, either
in the form of sensible heat or radiant energy. Therefore the
evapotranspiration process is governed by energy exchange at the land surface
and is limited by the amount of energy available. Because of this limitation,
it is possible to predict the regional actual evapotranspiration by applying
the principle of energy conservation. Recently, remote
sensingtechniques have developed rapidly. From satellite observation,
people can obtain consistent and frequent spectral reflectance and
emittance of radiation of the land surface in a basin scale, so it is
possible to estimate the regional evapotranspiration rate by combining remotely
sensing data with the solar radiation observation based on surface energy
balance model. In the past decades, considerable efforts have been made to
gaining experience and deriving appropriate models to counter this
challenge(Norman, Kustas et al., 1995; Bastiaanssen, Menenti et
al., 1998; Bastiaanssen, Pelgrum et al., 1998; Su
2002). Several algorithms were developed and they all have been applied and
validated in some regions(Su and Jacobs 2001; Su, Mccabe et al., 2005).
The Surface Energy Balance System (SEBS) model was developed by Su
(2002) to estimate land surface fluxes using remotely sensed data and available
meteorological observations. It has the most important advantage of its
inclusion of the a physical model for the estimation of the roughness height for
heat transfer which is the most critical parameter in the parameterization of
the heat fluxes of land surface. In this paper, SEBS has been
utilized firstly to estimate the surface fluxes over Hebei Plain
in Northeastern China by using MODIS/TERRA image. Thereafter, spatial
distributions of the daily evapotranspiration in Hebei Plain in combining with
the land cover maps were analyzed.
2. Study area
The study area, Hebei Plain, is located in the
north-eastern China between the range of 114°15¢E-117°45¢E and 36°N-39°40¢N (figure 1). Hebei Plain is one part of the North China Plain, and it
covers an area of 62004km2, which is more than 33% of
the Hebei Province. It is one of the largest agricultural areas
in China and also one of the most densely populated regions in the
world. Groundwater resource is one of the most important natural resources in
this area, because it provides drinking water to urban and rural communities,
supports irrigation and industry, sustains the flow of streams and rivers, and
maintains the ecosystems. The amount of water for agricultural as well as
industrial use has increased tremendously from 1970s(Zhang, Shi et al., 1997).
The water shortage became one of the constraint prevents further development.
Investigation has shown that more than 80% of groundwater resources abstracted
from aquifer were used for irrigation in this area(Zhang, Shi et al., 2005).
Due to the traditional irrigation pattern, a lot of water resources were wasted
directly. With the over-exploitation for more than 30 years, a series of
environmental problems have occurred, such as decline of regional groundwater
level, change of flow field, decrease of water resources and downward movement
of saline water body(Zhang, Shi et al., 1997). The
hydrogeological environments have changed in the past few decades and the
future sustainability of water resources in Hebei Plain is at risk.
In order to make better use of the groundwater
resources in the Hebei Plain, many studies have been concentrated on the
identification of groundwater net recharge and the identification of
agriculture water use(Wang, Lin et al., 2005). Several
approaches have been developed to quantify groundwater net recharge. In
regional studies, the water balance method is commonly used to estimate areal
net recharge, which is mainly controlled by three processes: precipitation,
surface runoff and actual evapotranspiration. Due to the little difference of
rainfall patterns in semi-arid area and commonly available real time runoff
data, main difficulty comes from the estimation of areal evapotranspiration
patterns, which have large differences because of land surface diversity. On
the other hand, duo to the large proportion of agriculture water use in the
Hebei Plain, it is also very important to determine the spatial and temporal
evapotranspiration to guide the irrigation water use. Hence, the main problem
goes into accurate regional evapotranspiration estimation.
Figure 1: Location
map of the study area
3. Methodology
3.1. Surface Energy Balance System (SEBS)
The surface energy
balance is commonly written as

Where Rn is
the net radiation, G the soil heat flux, H the
sensible heat flux and  is the
latent heat flux, which can be expressed as height of water, i.e.
evapotranspiration.
is the
latent heat flux, which can be expressed as height of water, i.e.
evapotranspiration.
The equation to
calculate the net radiation is given by

Where, Rswd, Rlwd is incoming
shortwave and outgoing longwave radiation respectively,  is the surface albedo,
  is the emissivity of the surface,
  is the Stefan-Bolzmann constant, equals to 5.67e10-8 and T0 the
surface radiative temperature.
is the Stefan-Bolzmann constant, equals to 5.67e10-8 and T0 the
surface radiative temperature.
The equation to
calculate soil heat flux is parameterized as
where Γc and
Γs are empirical coefficient. These values have been
determined using experimental observations, but depend also on the soil and vegetation
type. For most bare soil conditions a Γs value of 0.315 is
valid, and for vegetation often Γc is assumed to be 0.05. An
interpolation is then performed between these limiting cases using the
fractional canopy coverage, fc, which can be determined
from remote sensing data.
The sensible heat
flux is calculated by solving next three equations iteratively,


Where, ρ is
density of air [kg m-3], Cp is the heat
capacity of dry air [-], k is the Von Karman constant [=
0.4], z is the height at which the meteorological observations
are made [m], u* is the friction velocity [m s-1], θ0 and θa are
the potential temperature at height zoh and at
height z [K], d0 is the displacement
height [m], zoh and zom are
the surface roughness heights for heat and momentum transport [m], ψh and ψm are
stability correction function for heat and momentum transport, , g is
the accerelation due to gravity [m s-2] and θv is
the virtual temperature [K].
The surface energy
balance computation with the SEBS algorithm is based on the determination of
the relative evaporation fraction,

Where,  is the relative
evaporation fraction [-], the subscript “wet” and “dry” denote the wet
condition and dry condition respectively, detailed definition can be found in
Su (2002).
is the relative
evaporation fraction [-], the subscript “wet” and “dry” denote the wet
condition and dry condition respectively, detailed definition can be found in
Su (2002).
The evaporative
fraction is finally given by:

By assuming that
the daily value of evaporative fraction is approximately equal to the
instantaneous value, the daily evaporation can be determined as,

where  is the actual
evaporation on daily basis
is the actual
evaporation on daily basis , λ the
latent heat of vaporization (
, λ the
latent heat of vaporization ( ),
),  the density
of water (
the density
of water ( ) and
) and  is the daily
net radiation flux.
is the daily
net radiation flux.
3.2 Parameterization of Surface bio-physical characteristics
In order to run SEBS, surface bio-physical parameters should be prepared
firstly as model inputs. Those inputs can be derived from remote sensing data
by applying related empirical equations.
Normalized Difference Vegetation
Index (NDVI)
The normalized
difference vegetation index (NDVI) as defined by,

Where,  red and
  nir are reflectance
measurements in MODIS channels 1 (0.620-0.670μm) and 2 (0.841-0.876μm).
nir are reflectance
measurements in MODIS channels 1 (0.620-0.670μm) and 2 (0.841-0.876μm).
This is the most commonly used vegetation descriptor from satellite
imagery. The difference in reflectance is divided by the sum of the two
reflectance bands. This compensates for different amounts of incoming light and
produces a number between 0 and 1. The typical range of actual values is about
0.1 for bare soils to 0.9 for dense vegetation.
Vegetation fractional cover
Fractional Vegetation Cover is an important parameter that have key role
in the energy exchanges at the land surface. A simple procedure to
determine fractional vegetation cover is proposed by Gutman et al.as(Gutman
and Ignatov 1998),

Where, NDVImin is
the NDVI for bare soil and NDVImax for full
vegetation coverage.
Leaf area index (LAI)
Leaf Area Index (LAI) is the leaf area per unit ground area, which
reflects the vertical vegetation amount. The relationship
proposed by Su is used(Su and Jacobs 2001), this reads

This formula is
strictly only good for low vegetation since NDVI saturates at higher LAI
values. However, because of limited information for the study area to support
more sophisticated formulations, this equation is adopted in this study.
Surface emissivity
By analysing the
relation between surface emmisivity and NDVI, an experimental relationship was
obtained by Van de Griend et al. to determine surface
emissivity(Van de Griend and Owe 1993),

Aerodynamic roughness height
Aerodynamic roughness height is a very important parameter in surface
energy balance model, which influence greatly the turbulent characteristics
near the surface where the heat fluxes originate. Aerodynamic roughness
height can be estimated by a simple relationship proposed by
Su(Su and Jacobs 2001),

Vegetation height and displacement height
A conversion is performed
according to Brutsaert to derive vegetation height and displacement height for
a given aerodynamic roughness height(Brutsaert 1982),


4 Available
Dataset
4.1 Satellite observations
Satellite image
over the Hebei Plain from March 4, 2005 (DOY 63) were used. Use is made of the
surface reflectance products and surface temperature products of MODIS images,
MOD 09 and MOD 11, which can be ordered and downloaded from Earth Observing
System Data Gateway. In order to get whole
coverage of the study area, two set of images titled “h26v05” and “h27v05” were
selected. The surface albedo were estimated based on the algorithm proposed by
Liang(Liang 2001; Liang, Chad et al., 2003).
4.2. Meteorological observations
The Chinese National Meteorological Centre (NMC) operates several
meteorological stations in Hebei Plain on a daily basis. The dataset available
from these stations include relative humidity, wind speed, air temperature at
2m height, actual vapour pressure, rainfall, sunshine hours and open water
evaporation, etc. All of those measurements have been collected from 6
meteorological stations equally distributed within the study area on March 4,
2005. Pre-processing of those measurements was made to derive the variables
over satellite passing time as inputs of SEBS.
4.3. Land cover
Due to the limited knowledge about the ground truth land cover over
Hebei Plain, the MOD12Q1 Land Cover Product was selected in this study.
Totally, 12 kinds of land cover types were recognized in study area. Among
them, the dominant land cover type is crop land, and more than 91.47 % of the
area is for agricultural land use. Urban and built areas are the second large
land cover class in Hebei Plain, which present more than 3 percent according to
the map. Grass also play an important role in study area, most of which located
in the seashore area of eastern Hebei Plain.
4.4. Field Lysimeter Measurements
The lysimeter data measured at Luancheng Agro-Ecosystem Station (LAES)
were selected as ground truth evapotranspiration to validate the remotely
sensed actual evapotranspiration. Note that, to keep the represent, the same
agronomic practices were carried out inside and outside of the lysimeter(Liu
and Wang 1999).
5 Result and
Discussions
5.1 Comparison SEBS results to field measurements
The accuracy of SEBS result daily actual evapotranspiration was analyzed
by comparing with the ground truth daily actual evapotranspiration and crop
evapotranspiration. Two empirical methods were applied to get the crop
evapotranspiration based on the routine meteorological observations on the
site.
‘Kc-ET0’ approach is introduced in FAO Irrigation and Drainage Paper
No.56 to calculate the crop evapotranspiration under standard conditions(Allen,
Luis et al., 1998). As the main crop product area in China,
the farm land of Hebei plain is under a very good management and irrigation
water supply, especially in Taihang Mountain foot plain where Luancheng
Agro-Ecosystem Station locates, so ‘Kc-ET0’ approach can be applied, which is
given as,

Where ET0 is the reference crop evapotranspiration [mm d-1]
determined by Penman-Monteith equation and Kc is
the crop coefficient [-]. Times series of Kc values can be referred to
Liu et al(Liu, Zhang et al.,2002).
Another commonly
used methods to estimate the crop evapotranspiration in China is
based on the pan evaporation,

Where, E0 is
the pan evaporation [mm d-1], the crop
water consumption coefficient [-] and empirical values for main
crops of different months in North China plain is summarized by Han et
al(Han, Zhen et al., 2004).
Figure 2 shows the
comparison between the daily evapotranspiration values obtained from SEBS and
from other approaches mentioned above based on the point measurements. It shows
a good agreement between the SEBS modeled ETa and ground truth observations.
The little difference between them can be explained by surface diversity and
pixel based remote sensing techniques. In conclusion, SEBS is a useful tool to
estimate evapotranspiration.
5.2. Spatial Evapotranspiration
The estimated evaporative fraction and daily evapotranspiration over
study area on 4 March, 2005 are shown as figures 3 and figure
4. Figure 5 shows their histogramsThe range of evaporative fraction
is between 0.37 and 0.53. The highest values that about 0.48 to 0.53 can be
found in the central plain and other area have the low values ranging from 0.37
to 0.48. The lowest values only distributed sparsely in the south-west and
north part of the area.
a: daily actual evapotranspiration measured by lysimeter
b: daily crop evapotranspiration estimated from ET0
c: daily crop evapotranspiration estimated from Pan evaporation
d: daily actual evapotranspiration modelled by SEBS
Figure 2:
Comparison of the daily evapotranspiration between estimated by SEBS and
obtained from observations
The spatial distributions of ETa have the similar patterns. Central Hebei Plain has the highest ETa ranging form 1.46 mm day-1 to 1.79 mm day-1, but some lower values that below 1.45 mm day-1 can be seen clearly along the dry river bed to the north of Shijiazhuang City. The lower ETa values that below 1.3 mm day-1 are sprinkled on the north part and south part the plain. The statistical characteristics and histogram of ETa over each land cover types are shown as table 1 and figure 5.
In early March, the highest ETa values that up to 2.34 mm day-1 are
found from the open water surface in the eastern seashore area and lakes in the
plain. Although a high ETa values for croplands were found in the ETa maps,
which mostly situated in the central plain, statistically lower mean values
were obtained due to the large area it covers with different climatic
conditions and variable actual evapotranspiration.High Eta values in barren
orsparsely vegetated land in dicates the abundant soil moisture under giound in
this season.
According to the distribution patterns in ETa
histogram and daily ETa statistics over each land cover, the highest ETa were
presented in the free surface water body, the mean of which is about 1.87
mm day-1. Surface evapotranspiration is mainly controlled by
available soil moisture and incoming solar radiation as well as other
environmental aspects. When under the same environmental conditions, for
example, same surface wind speeds, radiation, air temperature etc.highest ETa
values is expected in open water surface with abundant water for evaporate. The
lowest ETa values were found in crop land, which is only about 1.24
mm day-1 as mean. This is contradicting to the well
irrigation management status over the
farm land of Hebei Plain. However, due to large coverage of
the study area, high spatial variety is possible not only for the local
climatic conditions but also the irrigation performance in different area, so a
lower mean ETa values is reasonable and explainable.
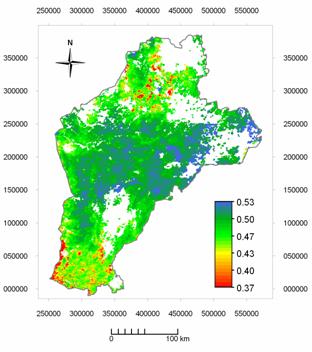
Figure 3: Evaporative fraction [-] over Hebei Plain on March 4, 2005
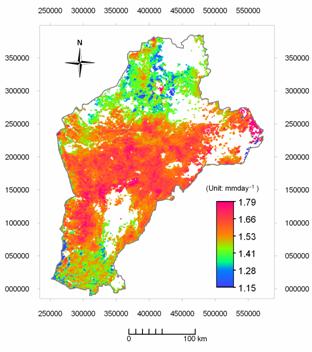
Figure 4: Daily evapotranspiration over Hebei Plain on March 4, 2005

Figure 5: Histogram of evaporative fraction and evapotranspiration over Hebei Plain on March 4, 2005
Table 1: The
statistics over each land cover classes in study area on 4 March, 2005 (mmday-1)
|
|
Barren |
Cropland |
Forest |
Grass land |
Shrub land |
Urban |
Water |
|
Minimum |
0.21 |
0.03 |
0.24 |
0.12 |
0.36 |
0.34 |
1.39 |
|
Maximum |
2.09 |
2.14 |
2.15 |
2.28 |
2.11 |
2.18 |
2.34 |
|
Average |
1.68 |
1.24 |
1.41 |
1.56 |
1.55 |
1.48 |
1.87 |
|
St. dev |
0.4 |
0.5 |
0.6 |
0.4 |
0.3 |
0.4 |
0.3 |


Figure 6:
Histogram of daily ETa over different land cover types in Hebei Plain on 4
March, 2004
The statistics reflects that the urban and built-up area also have a certain amount of evapotranspiration. This is contrary to the knowledge that the residential areas should have lower ETa. This can be explained by the pixel based remote sensing techniques. The pixels of urban area includes not only the construction but also the water body, street trees and grass parcels, which all have very high evapotranspiration. Therefore, the estimated ETa in urban area represented the mixed effection of all these things.
6 Conclusion and
recommendation
In this study, the SEBS model has been evaluated at local scales using
in situ measurements and meteorological observations. Results indicate that
daily evapotranspiration predictions form SEBS perform very well when assessed
against in situ actual evapotranspiration derived from lysimeter measurements
and crop evapotranspiration derived from empirical equations based on the
meteorological observations. Without doubt, due to the pixel by pixel
based remote sensing techniques, some error must occur, especially, when the
coarse resolution images were used.
Based on the
accuracy analysis of SEBS model, spatial distribution of daily actual
evapotranspiration over Hebei Plain on March 4, 2004 were determined and
discussed, in combination of the up-to-date land cover types in study
area. Results shows that Central Hebei Plain has the highest ETa ranging form 1.46
mm day-1 to 1.79 mm day-1, but some
lower values that below 1.45 mm day-1 can be seen
clearly along the dry river bed. The lower ETa values that below 1.3
mm day-1 are sprinkled on the north part and south part
the plain. When taking land cover types into account, as expected, open water
surface have the highest ETa over the study area, and due to high surface
variety in Hebei Plain, the lowest values were found in the crop land with a
mean values 1.24 mm day-1.
This study could
re-establish the fact that, the application of remote sensing brings a
significant contribution to estimate the spatial evapotranspiration in regional
scale for all types of land covers. However, the ground observation based
methods are always very important, especially in verifying the results of
different remote sensing based approaches. In this study, the lysimeter data in
Luancheng Agro-Ecosystem Station is vital in this regard.
It is acknowledged
that evapotranspiration is computed not for its own sake but for other purpose,
regional water resources evaluation and management, irrigation performance
assessment, as well as global climate change etc. for example. In this regard,
further consideration should be addressed according to the fields it applied.
Take the regional water balance research as an example, how to get regional
scale actual evapotranspiration on cloudy days is challenging.
Reference
[1] Allen, R. G., S. P.
Luis, et al. (1998). FAO Irrigation and Drainage Paper No. 56: Crop
evapotranspiration--guidelines for computing crop water requirements. Rome, FAO.
[2] Bastiaanssen, W. G. M., M. Menenti, et al. (1998). "A
remote sensing surface energy balance algorithm for land (SEBAL) 1.
Formulation." Journal of Hydrology 212-213: pp.198-212.
[3] Bastiaanssen, W.
G. M., H. Pelgrum, et al. (1998). "A remote sensing surface energy balance
algorithm for land (SEBAL) 2. Validation." Journal of Hydrology 212-213:
pp.213-229.
[4] Brutsaert, W.
(1982). Evaporation into the atmosphere. Reidel, Dordrecht: 299.p.
[5] Gutman, G. and A. Ignatov (1998). "The
derivation of the green vegetation fraction from NOAA/AVHRR data for use in
numerical weather prediction models." International Journal of Remote
Sensing 19(8): pp.1533-1543.
[6] Han, S. M., L.
Zhen, et al. (2004). "Comparing Two Methods for Calculating Major Crop
Evapotranspiration in the Pediment of Mt. Taihang." Journal of Irrigation
and Drainage 23(6): pp.66-68 (in Chinese).
[7] Jensen, M. E., R.
D. Burman, et al. (1990). Evapotranspiration and Irrigation Water Requirements.
ASCE Manuals and Reports on Engineering Practices. New York, American Society
of Civil Engineers. 70:pp.332.
[8] Liang, S. (2001).
"Narrowband to broadband conversions of land surface albedo I:
Algorithms." Remote Sensing of Environment 76(2): pp.213-238.
[9] Liang, S., J. S.
Chad, et al. (2003). "Narrowband to broadband conversions of land surface
albedo: II. Validation." Remote Sensing of Environment 84(1): pp.25-41.
[10] Liu, C. M. and H.
Wang (1999). The Interface Processes of Water Movement in the
Soil-Crop-Atmosphere System and Water-saving Regulation. Beijing, Science
Press.
[11] Liu, C. M., X. Y.
Zhang, et al. (2002). "Determination of daily evaporation and
evapotranspiration of winter wheat and maize by large-scale weighing lysimeter
and micro-lysimeter." Agricultural and Forest Meteorology 111: pp.109-120.
[12] Norman, J. M., W.
P. Kustas, et al. (1995). "A two-source approach for estimating soil and
vegetation energy fluxes from observations of directional radiometric surface
temperature." Agricultural and Forest Meteorology 77: pp.263-293.
[13] Penman, H. L.
(1947). Natural evaporation from open water, bare soil and grass. Proceedings
Royal Society of London, Series A. Mathamatical and Physical Sciences, London.
[14] Penman, H. L.
(1956). "Estimating Evaporation." Transactions of the American
Geophysical Union 37(1): pp.43-50.
[15] Su, H., M. F. Mccabe, et al. (2005). "Modeling evapotranspiration
during SMACEX : comparing two approaches for local- and regional-scale
prediction." Journal of hydrometeorology 6: pp.910-922.
[16] Su, Z. (2002).
"The Surface Energy Balance System (SEBS) for estimation of turbulent heat
fluexs." Hydrology and Earth System Sciences 6: pp.85-99.
[17] Su, Z. and C. Jacobs (2001). ENVISAT: actual evaporation.
BCRS Report 2001 : USP-2 Report 2001 01-02. Delft, Beleidscommissie Remote Sensing (BCRS): 57.p.
[18] Van de Griend, A. A. and M. Owe (1993). "On the
relationship between thermal emissivity and the Normalized Difference
Vegetation Index for natural surfaces." International Journal of remote
sensing 14(6): pp.1119-1131.
[19] Wang, G. L., W. J.
Lin, et al. (2005). "Numerical modeling on groundwater table variation
responding to water saving agriculture." Journal of Hydraulic Engineering
36(3): pp. 1-7 (in chinese with english abstract).
[20] Zhang, Z. H., D.
Shi, et al. (1997). "Evolution of Quaternary groundwater system in North
China Plain." Science in China Series D (Earth Sciences) 40(3): pp.276-783
(in Chinese with English abstract).
[21] Zhang, Z. H., D.
Shi, et al. (1997). "Evolution and development of groundwater environment
in North China Plain under human activities." Acta Geoscientica Sinica
18(4): pp.337-344 (in Chinese with English abstract).
[22] Zhang, Z. H., J.
S. Shi, et al. (2005). Water-saving agriculture and sustainable groundwater use
in Hebei Plain. Science Report, Institute of Hydrogeology and Environmental
Geology, CAGS: p.302 (in Chinese).