


Achievements
SOIL MOISTURE DYNAMIC CHARACTERISTICS OF WELL-IRRIGATION AREAS IN BEIJING PLAIN UNDER COMPARATIVELY DEEP GROUNDWATER TABLE CONDITIONS
Shi-jun Sun1, Yao-yuan Ding2, Bo Cao2
1. Shenyang Agricultural University; Shenyang 110161,China
2. Beijing Hydraulic Research Institute, Beijing 100044,China
Abstract: Since the 1980s, more and more groundwater resources have been extracted in the northern plains of
Key words: well irrigation areas, rainfall and runoff, groundwater, soil water dynamic state
Introduction
Soil water plays a central role in the interaction between surface water and groundwater. It is a vital water resource especially for the agricultural sector, whereby they are absorbed by crops after transforming from rainfall and irrigation water. In the past 20 years, because of insufficient rainfall and uneven rainfall distribution in different seasons of each year, many research projects have been carried out to look into the soil-water movement laws and potential rainfall use in the arid and semi-arid areas in
Since the 1970’s, shallow groundwater has been utilized in most parts of the country. Particularly in the last 20 years, groundwater has been over-extracted in northern
At the same time, with the increase of unsaturated soil depth, the soil capacity of water storage increases as well. Some studies in the northern
In this paper, soil water content dynamic characteristics of well irrigation fields is discussed by examining observation data from the Tiantanghe Valley water resources experimental site in the south-eastern plain of Beijing, which would provide vital information for extracting groundwater rationally, making full use of rainfall and recharging soil water resources in the northern China plain.
The experimental site is located on the left bank of Yongding River in the south-eastern suburb plain of Beijing, whereby the total area is
Soil Moisture Dynamic Characteristics in Different Depth
There is a designated soil moisture observation station in the water resources experimental site, where a 503DR neutral probe and soil moisture tension meter were set up to survey the 0-3m deep soil water content periodically and four years data has been attained from 1991 to 1995. Figure 1 shows the typical soil profile in the experimental fields.
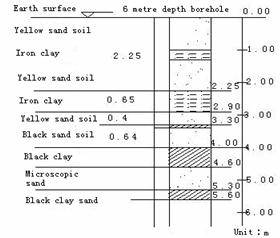
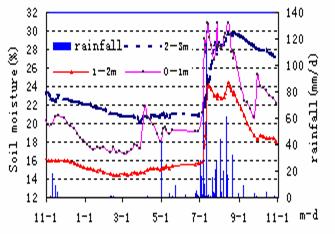
Fig.1 Representative soil profile in experimental region Fig.2 Soil moisture dynamic variations in different soil depths(1 Nov 1993 to 1 Nov 1994)
Fig.2 shows that soil moisture often fluctuates in the
Soil Moisture Dynamic Characteristics in Different Seasons for One Year
During the experimental period from 1991 to 1995, dry periods were encountered in 1992 and 1993(annual rainfall of 400.8mm in 1992 and 359.4mm in 1993), and wet periods for 1994 and 1995 (annual rainfall of 751.2mm in 1994 and 624.5mm in 1995). Soil moisture changes over these years provided a good representation on current conditions. According to the variation of water content within one year, 3 phases could be deduced, which are the simple fluctuation period in the spring irrigation season, sharp change period in the rainy season and slow decrease of soil moisture from late Autumn to early Spring (in Fig.3, soil moisture in average soil depth of 0-3m, weight percentage).
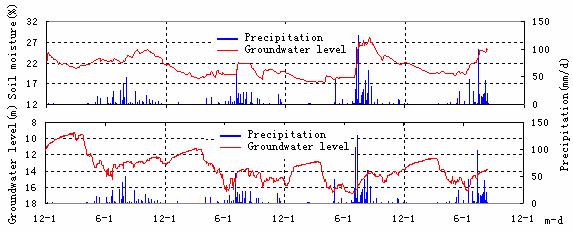
Fig.3 0~
Soil Moisture Dynamic Characteristics during the Spring-irrigation Period
Irrigation time for wheat in North-China takes place during the spring period of the middle of March to May. Less precipitation is generally encountered at that time, and the weather is dry with the air temperature increases gradually. Evapo-transpiration of soil moisture is intense during spring time, resulting in the need for field irrigation. Affected by irrigation, the upper soil moisture of the 0-3m depth of soil fluctuates frequently, but its variation is relatively small at within 4%. After one or two days of wheat irrigation, the soil moisture in the 0-1m soil layer reaches a peak value, and at the start of the infiltration process, the deep soil moisture of the 1-2m and 2
The effect of spring-irrigation on soil moisture is analyzed using the following data from a case study conducted at the end of March 1994. The total precipitation was
According to the need for wheat growth, about
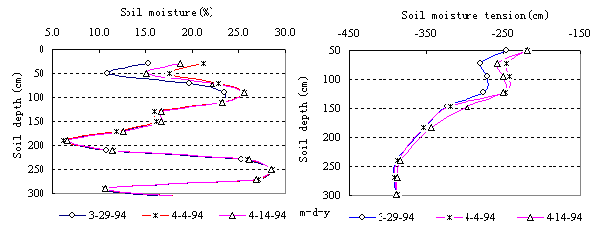
(a) (b)
Fig.4 Variations of soil water storage during the spring irrigation season , 1994
Soil Moisture Dynamic Characteristics during the Rainy Season
Over 80% of annual rainfall took place in June to September (rainy season) according to the 20 year historical data, with the soil moisture in 0
(1)The following is based on a single rainfall event took place in the middle of June 1995, analyzing the soil moisture changes before and after the rainfall event. Table 1 shows all the rainfall events in the experimental site from 2 June to 25 June 1995.
Table1 Rainfall process in the experimental area on June 2-26, 1995
Date | 2 June | 12 June | 13 June | 16 June | 17 June | 25 June | Total |
Rainfall (mm) | 0 | 0.1 | 0.2 | 45.2 | 27.1 | 0.4 | 73 |
According to the recorded observation, from 9 to 14 June, soil moisture in the 0
Till 16 and 17 June, 72.3mm rainfall depth is obtained. 3 days later, the soil moisture of 0
There was no rainfall event during 17 to 24 June, so soil moisture in 0
It is believed that , under the condition of dry field soil ,when a single rainfall event under
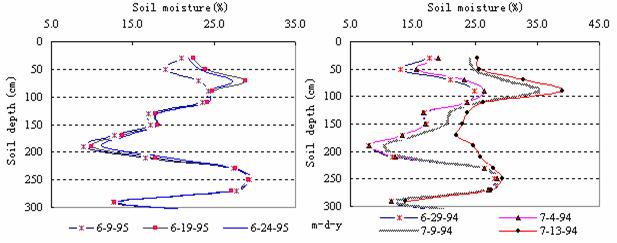
Fig.5 Variations of soil water storage in the rainy season of 1995 Fig.6 Variations of soil water storage in the rainy season of 1994
(2)In order to analyze the soil moisture changes before and after certain large rainfall events, another case study based on several major rainfall events in the middle of July 1994 was put forward.
There were 6 rainfall events from 29 June to 13 July (Table 2), among these , 2 rainfall events were above 100mm( 7 July, 12 July ).
Table 2 Rainfall process on July 2~12,
Date | 3 July | 5 July | 7 July | 8 July | 11 July | 12 July | Total |
Precipitation(mm) | 46.9 | 20.7 | 106.5 | 10.1 | 16.6 | 132.5 | 333.3 |
A total of
There was no rainfall event on both 9 July and 10 July. The soil moisture in the 0-1m soil layer reduced gradually owing to surface soil transpiration, but increased in the 1-3m soil depth. Then it rained for
The soil moisture in the 0-3m soil depth increased 7.99% from 29 June to 13 July. Another important fact is that there was almost no runoff occurring in the experimental fields after that rainstorm took place on 12 July according to the field investigation. A special borehole at the experimental site showed that its groundwater level raised
From the above two cases, it can be concluded that, when there is no previous rainfall event or it rains little under dry soil conditions, if a single rainfall events below
Soil Moisture Dynamic Characteristics from the End of Autumn to Early Spring
Soil moisture changes slowly during the middle of November to early March. There are less rainfall events or field irrigation. In addition, because it is the cold season of the year, soil water transpiration is relatively lower than the usual season. The soil moisture fluctuates little, and the general trend is going down (Fig.2, Fig.3.). On the other hand, to early March, along with the rise of air temperature and rapid growth of winter wheat , evapo-transpiration increase significantly. Soil moisture decreases to the lowest of the year, but groundwater level reaches its highest point of the year before the coming spring irrigation for wheat begins.
Effect of Different Rainfall Years on Soil Moisture
The changes of soil moistures are different before and after rainy seasons in different rainfall years. Table 3 shows the related data on soil moisture in different rainfall years.
Table 3 Comparison of soil water content of 0
| Before rainy season | End of rainy season | End of rain season/beginning | Rain season | |||||
Year | Date | Average soil moisture ( %) | Date | Average soil moisture ( %) | Increment of soil moisture ( %) | Period ( m.d) |
rainfall ( mm) (1) | Total increment of soil moisture ( mm ) (2) | Proportion ( % ) (3)= (1)/(2)×100 |
1992 | Mid of June | 22.39 | Early of Oct. | 24.72 | 2.33 | 6.20~10.05 | 333.0 | 243.2 | 75.1 |
1993 | Early of June | 19.19 | Late of Sept. | 20.12 | 0.93 | 6.09~9.29 | 292.4 | 237.7 | 81.3 |
1994 | Early of June | 18.53 | Late of Sept. | 23.72 | 5.19 | 6.29~9.29 | 650.4 | 578.7 | 88.9 |
1995 | Late of May | 19.35 | Late of Sept. | 23.57* | 4.22* | 6.09~9.29 | 563.7 | 433.3* | 76.9* |
Note:Details of calculation process is in reference [11]。
Table 3 shows little rain in the rainy seasons of 1992 and 1993. The increments of soil moisture after the end of rain season were only 2.33% and 0.93% respectively, more than that of the beginning of the rainy season. But in 1994 and 1995 the increments of soil moisture reached 5.19% and 4.22% respectively, several times more than that of 1992 and 1993. So it is obvious that field soil is getting less water supply after the end of the rainy season in a dry year and vice versa. During the rainy year, the groundwater level increases significantly because of more rainfall infiltrates into the soil. As the groundwater levels are comparatively deep in the experimental site (generally beyond
Conclusions
With the experimental area representing typical well-irrigation fields (without surface water supply for agricultural purposes), the soil moisture variations within a year are composed of 3 phases, firstly the simple fluctuation period in spring irrigation season (from March to May), then the sharp change period in rainy season (from June to September ), and subsequently the slow reduction of soil moisture from late Autumn to early Spring (from October to March). Among these periods, soil moisture decreases notably during the spring irrigation season, increases evidently during the rainy season and goes down again as a whole from late Autumn to early Spring.
Under dry soil conditions (non rainy season), when there is agricultural irrigation or the occurrence of a rainfall event (less than
Currently the groundwater depth extends beyond 7m in the
Acknowledgement
The author wishes to thank Professor Tian,Yuan and Professor Xue, Song for their constructive contributions.
References
[1] Zhang, Li, Zhang, Caiying, Peng, Chunxiang(1988). Developing water storage scheme in the
[2] Wang, Jiantian, Xu, Zhuling(1993). Soil moisture dynamic changing characteristics and relative measurements on making use of rainfall in arid zones. Journal of
[3] Gong, Xuechen, Yang, Liting, Niu, Ruiming(1998). Agricultural field soil moisture movement trends analysis in the semi-arid plain of north-eastern Heibei privince. Journal of soil and water conservation 4,88-91.
[4] Yang, Xingguo, Ke, Xiaoxin, Zhang, Xudong(2000).Study on soil water content movement characteristics in rain-fed agricultural fields of
[5] Yan, Changrong,Ju, Hui, Peng, Shiqi(2002).Agricultural field soil water content dynamic characteristics in the arid northern
[6] National Information Association of Groundwater(2000).Summary of 7th national conference of groundwater in
[7] Ding, Yueyuan,Xue,Song(1994). Experimental research of making use of surface and groundwater jointly in the typical plain of Beijing.Beijing Hydraulic Research Institute Report No12.
[8] Fang,Sheng,Chen,Xiuling(1999).Multi-objective and comprehensive management measures of irrigation fields under the condition of joint control using surface water and groundwater. Groundwater 21,79-83.
[9] [9] Xue, Song,Shi, Fengcai(1999). Flood water controlling and usage. Research and practice of National groundwater development and utilization,24-29.
[10] Sun, Shijun, Ding, Yueyuan, Tian, Yuan(2001).Study on the use of precipitation and runoff during the flooding period to regulate and control groundwater in the
[11] Sun, Shijun, Ding, Yueyuan, Cao, Bo(2002). Regulating capacity of soil reservoir in the well irrigation fields of
[12] Lei, Zhidong,Yang,Sixiu,Ni, Guangheng(1992). Soil water content dynamic characteristics under different groundwater levels.Journal of Hydraulics 2,1-6.