


Achievements
THE FACTORS OF NITROGEN BALANCE AND TRANSP- ORT THROUGH UNSATURATED ZONES OF SOIL IN IINTENSIVE CCULTIVATION REGION
Zhang Dayi1, Li Guanghe1, Guo Huaming1, Lu Chang’ai2, Zhangxu1
1, Department of Environment Science and Engineering,
2,
Abstract: Local investigations and in-situ experiments were carried out in this research to investigate the nitrogen balance among water-soil-plant-air continuous (WSPAC) and the control factors of nitrogen balance and transport through unsaturated zones of soils in drainage area of
Key words: nitrogen, unsaturated zones of soil, denitrification, balance and transport
1 Introduction
Groundwater is an important source of drinking water in the world and it is generally considered to be a very good source of drinking water because of its clarity and temperature stability. Recently, however, contamination of groundwater by pathogens such as Cryptosporidium and Giardia has been reported in the
Contamination of groundwater by nitrate has occurred in many European countries and is also becoming a serious problem in
2 Materials and methods
2.1 Experimental area
Dayu, as shown in figure 1 and located in approximately 25 Km southwest of
Estimation of plant nutrient in
2.2Experimental treatment
In situ experiments were conducted in the greenhouse cultivating celeries with an area of 46.5 ×

Fugure 1 Villages’ Distribution in Dayu
2.3 Analytical methods
Prior to celery transplantation, TDR (TRIME-T3) and WM-1 tensiometers were installed at 0.3, 0.6, 1.0, 1.5, 2.0,
Simultaneously, the soil water samplers were set up at locations corresponding to TDR and WM-1. In order to avoid disturbing soil structure, the soils were carefully dug out and replaced at their original locations after installation of experimental equipments. A well, penetrating into 5 m BGL, was installed to monitor groundwater table to 2 m east of the experimental site during the experiment. Groundwater table slightly fluctuated during the study from a minimum of 151 cm, and a mean of 191 cm BGL.
Table 1 Fertilizations in the field experiment in Dayu,
| Time | N (kg/ha) | P2O5 (kg/ha) | K2O (kg/ha) | |||
LFa | HFb | LFa | HFb | LFa | HFb | ||
Base fertilizer | Feb. 24, 2003 | 45 | 120 | 135 | 540 | 120 | 120 |
Top application | 405 | 1079 | 90 | 360 | 240 | 240 | |
1 | Mar. 15, 2003 | 40 | 108 | 18 | 72 | 30 | 30 |
2 | Apr. 6, 2003 | 81 | 216 | 36 | 144 | 60 | 60 |
3 | May 1, 2003 | 162 | 431 | 36 | 144 | 90 | 90 |
4 | May 26, 2003 | 122 | 324 | 0 | 0 | 60 | 60 |
a low fertilization plot; b high fertilization plot
Gas was collected by obturator box and gas velocity was controlled by flowmeter. NH3 was collected in 30min by 1 L/min and the adsorptive solution was H2SO4 (0.01N). NO/NO2 was collected in 30min by 0.2 L/min and the adsorptive solution was N-1-Naphthylenediumine dihydrochloride. N2O was detected by Shimadzu GC-14A gas chromatography meter. Column was filled with Porapak Q and carrying gas was N2 by 60 ml/min. Temperature of detect facility, column and entrance was 300, 60, 100℃ respectively. Standard N2O was provided by Nation Standard Material Research Centre and detected by CSIRO Air Institute,
Plant samples and soil samples were collected at the same time as follows: 20d, 40d, 60d and 90d.
3 Results and discussion
3.1 Nitrate pollution
The study area is completely covered by Quaternary loose deposits. Geologic form of the research area is mainly composed of Ⅳscarification, and hardpan and Q4a1 and Q4a1+1 is the main aquifers while the claypan is considered as the staunch. The upper of Q4a1 and Q4a1+1 is considered of floury sand with thickness of 0-10m and the lower of them is hardpan aquifer with thickness of 1.65-10m, whose structure is loose and well connectivity. This aquifer was mainly supplied by rainfall and surface water and drained into the
Nitrate polluted groundwater mainly distributed in seven areas as shown in figure2 which were Wulong village, Xin village, Tuluo village, Dahaiyan village, east farmland of Taipingguan, north farmland of Dayu and west farmland of Xiaohekou. Most of the NO3-N quality concentration was over 20 mg/l (National Drinking Water Standard) and up to 132.7 mg/L and 5.64 times higher above the Standard.
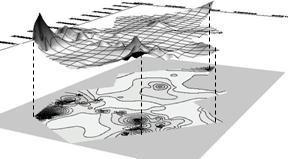
Fig. 2 Nitrate in groundwater distributing in research area
According to rainfall and evaporation data in twenty years, there is distinct rainy season and dry season. Rainy season is from May to October while the others are dry season.
Nitrate contents in groundwater in March and June were compared. In cultivation region, it was distinct difference that nitrate content was below measure threshold in dry season while 5-15 mg/L and up to 133 mg/L in rainy season. While in village region, it was no difference that nitrate in different season were at the same level. Figure 3 shows the nitrate time distribution.
*: c means in cultivation region; **: v means in village region
Figure 3 nitrate time distribution
3.1.3 Nitrate Change
According to geological form and the aquifer, 11 representative regions were chosen to analyze the nitrate change. Figure 4 shows that nitrate content in upriver position was less than that in backward position and it is obviously that nitrate came from crop field. Since BOD content in groundwater was so low that denitrification couldn’t occur, nitrate accumulated on the way until up above 10mg/L, which is much higher than 1.24 mg/L in
Groundwater level along
*: Z1U means Z1 Upper Position; Z1D means Z1 Dianchi Lake
**: Z1U - Z4D are shown in Figure 1
Figure 4 chemical characters of ground water
3.2 Nitrogen balance and transport
In this research, nitrogen was divided into two parts, one of which was Nitrogen Input, including mainly fertilization, and the other of which was Nitrogen Output, including soil withhold, plant use, volatilization (NH3, N2O, NO/NO2 and N2 etc) and eluviation.
3.2.1 Nitrogen volatilization
3.2.1.1 NH3
NH3 volatilization is direct loss of nitrogen and it is affected by soil character, weather and moisture, etc. Because the soils in plot field were acid and neuter soil and conservatory possessed closed what eliminated the effect of wind, main factors that influenced NH3 volatilization comprised cation exchange amount, temperature and moisture level. The results showed that day-temperature diversification influenced visibly the NH3volatilization efficiency and there were positive correlation between them. NH3 volatilization velocity was highest in autumn period because there were less nitrate adsorption and more redundant efficient nitrate in growth period than those in autumn period.
Investigation in different season and treatment showed that NH3 volatilization of Plot I is 0.09~0.72 kg NH3-N/hm2, which were 0.08% (LF) and 0.06% (LF) of total nitrogen input; NH3 volatilization of Plot II is 2.65~23.44 kg NH3-N/hm2, which were 2.57% (LF) and 1.96% (LF) of total nitrogen input. The main factors that affect NH3 volatilization are osmosis, temperature and moisture content with diversity analysis.
There were obvious correlation in different treatments between NH3 volatilization and nitrogen fertilization, what behaved volatilization amount in NF treatment was higher than control. This result can be explained that transpiration of soil and crops would accelerate water transpiration, which positively correlated with NH3 volatilization. There were specific linear correlation between NH3 volatilization and nitrogen fertilization in three treatments, including NF, LF and HF.
3.2.1.2 NOx
NOx discharge ability of soil was related to efficient nitrate content, and discharge amount had relationship with soil characters[4], climate factors and agriculture activities. NO/NO2 discharge velocity was laid on soil temperature, which would cause higher discharge velocity when it was higher. In growth period, NO/NO2 discharge velocity was higher. Dry-wet principle caused by irrigation changed the environment of soil, which enhanced nitrification and denitrification process[5]. Efficient nitrate fertilizer (carbamide, ammonium bicarbonate) was the main factor of higher NO/NO2 discharge velocity in growth period.
NOx volatilization loss in different treatments were shown as follows: in Plot I, NOx volatilization loss was 15.45-134.59 kgN/hm2 and the NOx volatilization was 13.86% (LF) and 11.22% (HF) of total nitrogen input respectively while 4.06% and 3.43% in CK and NF treatment; in Plot II, NOx volatilization loss was 18.71-183.97 kgN/hm2, and the NOx volatilization was 19.02% (LF) and 15.33% (HF) while 4.16% and 6.06% in CK and NF treatment. 4.16%和6.06%. Compared with different treatments, the higher nitrogen input, the higher NO/NO2 volatilization.
3.2.1.3 N2
N2O produced by denitrification in soil can be deoxidized to N2 by N2O Oxidation Enzyme (N2OR). Denitrification is in low N2O/N2 condition when field moisture content is 77% [7]. Based on locale inspection, field moisture content in research area was between 15% and 29% which is near to the optimal denitrification moisture condition propitious to denitrification[8]. N2 volatilization were 31.2~
3.2.2 Plant use
Absorption of efficient nitrate by plants can reduce content of anion nitrate and depress the transform of it, including volatilization, nitrification and denitrification. Since TN content soil in intensive cultivation region is high, nitrate used by plants is only a small part of TN and the effect that the usage of nitrogen in intensive cultivation region in less than in tradition forms. Besides that, the secretions and casts of crop root could enhance microbial amount and bioactivity to improve nitrogen volatilization loss.
The biomass and the nitrogen content of plant with different treatments have no distinct diversity. In Plot I, plant biomass is 7.3% (LF) and 10.7% (HF) higher than NF treatment, while plant nitrogen content is 10.2% (LF) and 11.4%(HF) higher; in Plot II, plant biomass is 8.7% (LF) and 11.4% (HF) higher than NF treatment, while plant nitrogen content is 5.2% (LF) and 14.5% (HF) higher. The results showed that the plant biomass and nitrogen content had no distinct relationship with the fertilization when nitrogen was superfluous in intensive cultivation area. Apparent fertilizer nitrogen usage in LF treatment was 20.8%-30.4%, higher than HF treatment which was 8.5%~11.5%.
3.2.3 Eluviation
The nitrogen input into the system is eluviated into groundwater except soil withhold, plant use and volatilization. The zero flux-plane method was used to calculate vertical infiltration recharge and evaporation-transpiration, which was based on the soil-water hydraulic theory that the water flux did not exist when a gradient of total potential of soil-water was zero. Irrigation intensity was averagely
3.2.4 WSPAC nitrogen balance and transport
The nitrogen balance among water-soil-plant-air continuous (WSPAC) included volatilization, plant use, eluviation and soil withhold, which determined the nitrogen transport and form. The results shows that plants, air, groundwater and the soil are the main components of WAPAC and the nitrogen input can resist or output through these four sections by transport. In WAPAC, nitrogen balance and transport in different conditions are showed in table 2.
Table 2 Losses of the nitrogen in the
multisystem
|
Experiment
zones |
Treatment |
Plant
use |
Volatilization |
Eluviation |
|||
|
Nitrogen
usage (kg
N/hm2) |
Percentage (%) |
Nitrogen
loss (kg
N/hm2) |
Percentage (%) |
Nitrogen
loss (kg
N/hm2) |
Percentage (%) |
||
|
I |
LF |
136.6 |
30.4 |
93.9~156.3 |
20.9~34.7 |
95.3 |
21.2 |
|
HF |
138.1 |
11.5 |
202.6~337.2 |
16.9~28.1 |
137.2 |
11.4 |
|
|
II |
LF |
93.5 |
20.8 |
137.2~222.8 |
30.5~49.5 |
174.5 |
38.8 |
|
HF |
101.8 |
8.5 |
299.4~483.4 |
25.0~40.3 |
239.9 |
20.0 |
|
3.3 Factors analysis
Only 30%-40% of nitrogen input (fertilizer) can be absorbed by plant and most of the nitrogen is lost into the environment through different ways, what reduces the nitrogen usage, increases the agriculture cost and causes the pollution of water environment, especially the groundwater environment. Some factors effects a series of physical, chemical and biochemical actions that influence the balance and transport between different forms of nitrogen as well as nitrogen and mediums in WAPAC.
3.3.1 Nitrification Effect
Like ammoniac, nitrate produced in denitrification can be absorbed by plants easily but is prone to eluviating in to the groundwater. Except for the physical and chemical characters of soil and fertilizer (organic or inorganic), the nitrification velocity can also be effected by depth of unsaturated zones and the form of irrigation. Nitrification is related with the depth of soil and the nitrification velocity is highest in surface layer soil, which is 2.50-8.53 mg/(kg·h). Nitrification effect weakens with the depth of soil increases until it reaches 0.6-1.0m, there the nitrification velocity is steady at 0.2-0.3 mg/(kg·h). The relationship of nitrification velocity in surface layer soil is: NF>LF>HF>CK, as shown in Figure 5.
3.3.2 Denitrification Effect
The result shows that the denitrification is related with the depth of soil obviously and the relationship presents saddle shape. Denitrification velocity reduces rapidly from 14.63~31.09 mg/(kg·h) to 5.46~8.72 mg/(kg·h) with the depth of soil increasing from 0.0 to
Fig. 5 Nitrification RateVelocity

Fig. 6 Denitrification RateVelocity
3.3.3 Ammonia Adsorption Effect
Ammonia is withheld by soil except plant use and nitrification and its adsorption can be calculated by ammonia equation according to the adsorption isothermal figure. The results showed that the ammonia equation accorded with the Freundlich linear adsorption isothermal mode and the adsorption coefficient reduces with the soil depth increasing. Ammonia adsorption affect mainly occurred in surface layer soil and the Adsorption quantity reduces when the soil depth increased.
4 Summary
In this study, local investigations and in-situ experiments were carried out in this research to investigate the nitrogen balance among water-soil-plant-air continuous (WSPAC) and the control factors of nitrogen balance and transport through unsaturated zones of soils. It was found that a number of environmental factors influenced the balance of nitrogen in groundwater. The experimental results can be summarized as follows:
High contaminant of nitrate in groundwater was related to the degree and years of cultivation and 39% of the nitrogen which caused eutrophication of
The quantity of NO3-N and NO2-N recharged into groundwater were related to fertilization. The values of vertical fluxed into groundwater of NO3-N were 19.30 (HF) and 5.52 (LF) g/plot and those of NO2-N were 0.96 (HF) and 0.73 (LF) g/plot.
The vertical infiltration recharge was limited by groundwater level and hydraulic conductivity of soil and this can be explained by higher withhold of soil in thicker unsaturated zone.
NO SIGNIFICANT DIFFERENCE OF PLANT USAGE WAS FOUND AMONG TREATMENTS OF 93.5-138.1 KG N/HM2, WHILE THE PERCENTAGE OF NITROGEN INPUT WAS QUITE DIFFERENT, 20.8-30.4% IN LF, HIGHER THAN 8.5-11.5% IN HF.
Nitrogen volatilized into the air is related to the denitrification ability stimulated by organic matter supply and the ammonia volatilization relevant to cation exchange and evaporation in soil. Redox potential has also been shown to affect denitrification rates, with higher rates in more reduced treatments. Denitrification rate in unvegetated treatment was 6.36 mg/(kg·h), higher than 2.79 mg/(kg·h) in vegetated one.
Vertical infiltration recharge and evaporation-transpiration rate were separately 0.363 mm/d in thick unsaturated zone while 1.851 mm/d on the other condition. The quantity of NO3-N and NO2-N recharging into groundwater are related to unsaturated zone. The values of vertical fluxing into groundwater of NO3-N were 19.30 g/plot and those of NO2-N were 0.96 g/plot in thicker unsaturated zone, while 108.52 g/plot of NO3-N and 0.11 g/plot NO2-N in thinner one, respectively.
Acknowledgements
I would like to acknowledge the field and laboratory work of Environment Institute,
References
[1] Hancock CM, Rose JB, Vasconcelos GJ, Harris SI, Klonicki PT, Sturbaum GD. Giardia and Cryptosporidium occurrence in groundwater. J Am Water Works Assoc 2000, 92 (9):117-23.
[2] Z. Feleke, K. Araki, Y. Sakakibara, T. Watanabe, M. Kuroda, Selective reduction of nitrate to nitrogen gas in a biofilm-electrode reactor, Wat. Res. 1998, 32 (9):2728-2734.
[3] Jin ZF, Chen YX, Wang F, Ogura N, Detection of nitrate sources in urban groundwater by isotopic and chemical indicators,
[4] Musters, P. A. D. Bouten, W. A method for identifying optimum strategies of measuring soil water contents for calibrating a root water uptake model. Journal of Hydrology, 2000, 227: 273-286.
[5] Brandelik, A. & Hubner, C. Soil moisture determination-accurate, large and deep. Phys. Chem. Earth. 1996, 21(3): 157-160.
[6] Yan Jin, Thilo Streck, William A. Jury Transport and biodegradation of roluence in unsaturated soil. Journal of Contaminant Hydrology, 1994, 111-127.
[7] Ridley AM, Mele PM, Beverly CR, Legume-based farming in southern
[8] Seunghee Choe, Yoon-Young Chang, Fyung-Yub Hwang, JeEhyeong Khim, Kinetics of reductive denitrification by nanoscale zero-valent iron, Chemosphere 2000, 41: 1307-1311.
[9] Davidson, E. A. Fluxes of N2O and NO from terrestrial ecosystems[A]. Rogers J E and Whitman W B, ed. Microbiol Production and Consumption of Greenhouse Gases: CH4, NOX and halomethanes[M].
[10] Hansen S, Mæhlum J E, Bakken L R. N2O and CH4 fluxes in soil influenced by fertilization and tractor traffic [J]. Soil Biol Biochem, 1993, 25:621-630.