Achievements
MODELING EFFECTS OF MOBILE PARTICLES AND PREFERENTIAL FLOW IN THE UNSATURATED ZONE ON GROUNDWATER ORGANIC CONTAMINATION
Cai Wutian
( Institute of Techniques and Methods in Hydrogeology and Engineering Geology, 071051 )
Abstract:There are often highly conductive preferential flows in the unsaturated zone that carry small particles such as dissolved organics and weathered products. When the surface is polluted by organic contaminants some of them are sorbed on the particles and enter saturated zone facilitated by the preferential flows. Because particles and preferential flows can relatively decrease the biodegradation of organic contaminants,this will lead to more serious contamination on groundwater. In this paper author uses 1D SMART (Streamtube Model for Advective and Reactive Transport) to separately or corporately model the effects of particles and preferential flows on groundwater organic (TCE) contamination. Results show that organic contamination concentration in groundwater will increase by 5 – 20 % for various scenarios in particle types (activated carbon, lignite), proportion of preferential flow, or particle and preferential flow combination.
Key words: unsaturated zone, particle, preferential flow, organic contaminants, modeling of groundwater contamination
1 Introduction
In the unsaturated zone there are often some mobile materials like dissolved organic matter, coal particles, weathering products and mineral precipitates. Soil structure and texture in the zone could form preferential flow. Enhanced Solute Spreading (ESS) is referred to those processes in which solutes are transferred to mobile materials (e.g. particle, surfactant, colloid), or can speed up solute passing through concerned domain.(e.g. preferential flow).
When the unsaturated zone is polluted by contaminants, some portion of contaminants is either inclined to be sorbed on mobile materials, or quickly enter preferential flow paths, or in a worst case, combining both processes. This implicates that some contaminants are excluded from biodegradation. ESS processes will result in an increase of contamination risk at the groundwater table. So it is meaningful to study the effects of ESS with relevant transport processes on the bioavaibility of contaminants for groundwater protection.
The objective of this paper is to quantify the effects of preferential flow, particle-facilitated transport and their combination on the bioavailability of contaminant transported from the unsaturated zone to the groundwater table using SMART model. Typical scenarios that could be met in the field are simulated in detail. Some valuable conclusions are reasonably deduced from simulation results.
2 SMART Model Concepts and Its Functions
SMART is the abbreviation of Streamtube Model for Advective and Reactive Transport. SMART is developed at the Center for Applied Geoscience in the
2.1 SMART model concepts
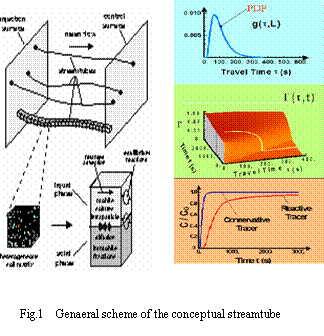
Assume the flow in the media is advective-dominant, an amount of conservative tracer flows from an input plane to output plane (Fig.1).
Due to the hydraulic heterogenities, the conservative tracer arrives at the output plane in a different timeح ,
According to calculation accuracy, we can evenly divide the travel time into many time interval Δ ح, each is thought as a tube. That means many tubes consist of the domain. Therefore, each tube represents a fraction of mass travel with the same velocity.
Based on tracer tests or analytical solution, we can generate a function of travel time ح, i.e., Probability Density Function (PDF) named as g (ح).

The most widely used analytical PDF expressions are:
(1) The piston-flow model (PFM) for homogeneous soil.
 (2-1)
(2-1)
where  is the travel time of an inert tracer.
(2) The convection-dispersion model (CDM) for homogeneous soil.
 (2-2)
(2-2)
where  is the linear average flow velocity (
 ) and
) and is the longitudinal dispersion coefficient (
  ).
).
The chemical reactions in each tube can be described by a reaction function, Γ( ح,t).The “length” of the streamtube is given by the maximum travel time τmax of the slowest fluid particle between the input and the control surface. Normalized breakthrough curves of a reactive tracer at the control surface is then given by:
C =
= (2-3)
(2-3)
Here,C is the breakthrough concentration observed at the control plane,
 is the PDF and
  is the reactive function at time
  .
.![]()
A crucial feature of the streamtube approach is that the influence of physico-chemical reactions (e.g. sorption/desorption, decay) on transport of reactive solute in groundwater can be considered separately from the impact of hydraulic heterogeneities or non-uniform groundwater flow.
SMART can be used as a forward modelling tool, i.e. the input data sets describing groundwater flow, transport and reactions only contains parameters which may be determined by field or laboratory experiments. SMART can well simulate the following transport process in an independent or coupled way under 1D steady state flow conditions.
1. pure advection
2. advection plus longitudinal dispersion along streamtubes
3. sorption/desorption
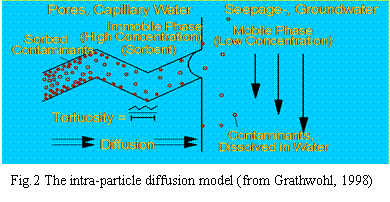
Both equilibrium and kinetic sorption/desorption processes are accounted for. Sorption/desorption kinetics is described as intra-particle diffusion of chemicals inside the grain particle of the porous aquifer material(Fig.2), which may consist of different lithological components with various grain size fractions.
4. biodegradation
The model can simulate biodegradation by first-order and n-th order kinetics or by LANGMUIR-HINSHELWOOD kinetics.
5. particle-facilitated transport

3 Simulation Assumptions in This Paper
3.1 Initial and boundary conditions
· One dimensional, steady state flow;
· There is a constant pollutant source near the ground surface where TCE is the only contaminant. TCE, particles, or both of them flow through a column with 
· Column material is made up of
· Initial concentrations of TCE and particles are zero;
· Degree of water saturation in the column is 50%;
· Total porosity is identical to effective porosity, set to be 30%;
· Groundwater recharge rate =  m/s, travel time for 1 pore volume (1 PV) in the matrix = 1.576799601
 seconds (182.5 days)
3.2 Properties of the contaminant, matrix, and particles
Specific properties of contaminants and lithocomponents that are needed for the simulations are listed in the following tables.
Table1: Contaminant properties
Name of contaminant | Daq (m | Log Kow | Log Koc |
Trichloroethene (TCE) | 1.04 | 2.42 | 2.21 |
Note: Daq - aqueous diffusion coefficient, Kow - octanol-water partitioning coefficient,
Koc - partitioning coefficient between organic carbon and water)
Table 2: Properties of lithocomponents
lithocomponent | Empirical tortuosity exponent | Organic carbon content | Dry solid density (kg/m |
Intra-particle porosity |
limestone | 2.0 | 0.00034 | 2164 | 0.01 |
lignite_particle | 2.0 | 0.389 | 1300 | 0.011 |
activated_carbon_particle | 2.0 | 0.890 | 890 | 0.55 |
4 Process-Based Scenarios Simulation
4.1 Effect of particle-facilitated transport
4.1.1 Scenario description
In practice, different kinds of particles with various sorption/desorption parameters for the same contaminant may occur. Therefore, it is necessary to simulate effects of various particles on the bioavailability of contaminants. Here, I choose activated carbon and lignite as two kinds of particles to independently simulate particle-facilitated processes.
4.1.2 Processes simulated and input parameters
(1) Advection without dispersion;
(2) First order biodegradation with half-life = 1 PV of matrix flow;
(3) Sorption, Kd = 1 L/kg between matrix and TC;
(4) Inflow concentration for TCE = 1 mg/l;
(5)Inflow concentration for particles = 10 mg/l;
(6)Freundlich coefficient (KFr) = 70797
 and Freundlich exponent (1/n) = 0.44 for activated carbon particles; Freundlich coefficient (KFr) = 48.97788

and Freundlich exponent (1/n) = 0.76 for lignite particles;
(7) Particle radius = 5.0 m.
m.
4.1.3 Results
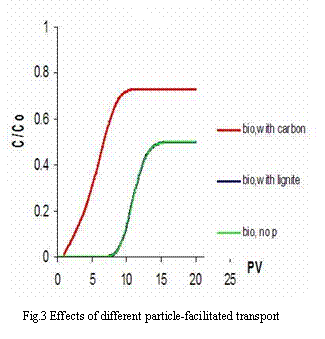
Breakthrough curves in Fig.3 are quite different between lignite particle-facilitated and activated carbon particle-facilitated transports. The later exhibits earlier breakthrough and higher concentrations than the former. That implies that there is much more mass of TCE adsorbed on activated carbon particles than on lignite particles. This is due to the difference between the Kd values. Tab.3 shows when TCE concentration increases from 0.01 mg/l to 10.0 mg/l, Kd values of both activated carbon particles and lignite particles decrease and the Kd value of activated carbon particles is 3653 to 401 times that of lignite particles. Based on calculation the transport with activated carbon particles can increase total mobile mass by 23.02% as compared to no particle transport, but for lignite particles the increase in total mobile mass is only 0.02%.

Table 3: Kd value (L/kg) of particles as a function of TCE concentration*
concentration (mg/l) |
0.01 |
0.05 |
0.1 |
0.5 |
1.0 |
5.0 |
10.0 |
activated carbon |
410634 |
166737 |
113098 |
45923 |
31150 |
12648 |
8579 |
lignite |
112 |
76 |
65 |
44 |
37 |
25 |
21 |
Ratio of Kd value |
3653 |
2182 |
1748 |
1045 |
837 |
506 |
401 |
* Kd values calculated by: Kd = KFr  (1/n)
(1/n)  Cw
Cw
4.2 Effect of preferential flow transport
4.2.1 Scenario description
Variation in volume fraction of preferential flow in the unsaturated zone is quite common. According to some reports (Flühler, 1992 and Seiler, 2000), three volume fractions of preferential flow, i.e. 10%, 25% and 50% are selected to give a quantitative comparison of their effects on contaminant bioavailability. To this end, a coupled cde-pf model for simulating the flow pattern of matrix
and preferential flow is used here, because of its high frequency met in the field.
4.2.2Processes simulated and input parameters
(1) no partcles involved;
(2) advection plus dispersion, dispersivity = 0.5 m for matrix;
(3) Sorption with Kd = 1 L/kg between matrix and TCE;
(4) 1 PV of matrix flow = 182.5 days, 1 PV of preferential flow = 18.25 days; i.e. velocity of pref. flow is 10 times faster than the average velocity of matrix.
(5) First order biodegradation with constant half-life equal to = 1 PV of matrix flow;
PDFs of arrival time for matrix and preferential flow are described by the CDE model and by the pf model respectively. The corresponding bimodal PDF is calculated by the formula (4-1) proposed by Utermann et al. (1990).
 (4-1)
(4-1)
where:  ----the coupled pdf;
  ----the pdf for matrix flow;
  ----the pdf for preferential flow;
  ----the volume fraction of preferential flow.
The coupled PDF are generated based on 10%, 25% and 50% of preferential flow (see Fig. 4).
4.2.4 Results
More preferential flow will always lead to a higher long-term TCE concentration (Fig.5). Effect of preferential flow on the contaminant concentration is proportional to the volume fraction. It comes out 3.15%, 7.87%, 15.74% higher than that of no preferential flow when preferential flow accounts for 10%, 25%, 50% of the total flow volume respectively.
4.3 Effects of Particle-facilitated combined with preferential flow transport
4.3.1 Scenario description
In this section, both particle- facilitated and preferential flow transport processes are simulated. This is the worst case for groundwater pollution. In order to make a comparative analysis with respect to different kinds of particles, lignite particles and activated carbon particles are separately used to simulate these processes.
4.3.2Processes simulated and input parameters
(1) Both particle and preferential flow are concerned;
(2) Advective plus dispersion with dispersivity = 0.5 m for matrix;
(3) First order biodegradation with constant half-life equal to = 1 PV of matrix flow;
(4) A coupled cde-pf model is generated which is same as one in Fig.3.
(5) 10% of preferential flow with a velocity being 10 times the average velocity of the matrix flow.
(6) Inflow concentration of TCE = 1 mg/l;
(7) Inflow concentration of particles = 10 mg/l;
(8) Particle radius = 5.0 m;
(9) Sorption with Kd = 1 L/kg between matrix and TCE;
(10) Freundlich coefficient (KFr) = 70797 
 and Freundlich exponent (1/n) = 0.44 for activated carbon particles; Freundlich coefficient (KFr) = 48.97788
 and Freundlich exponent (1/n) = 0.76 for lignite particles.
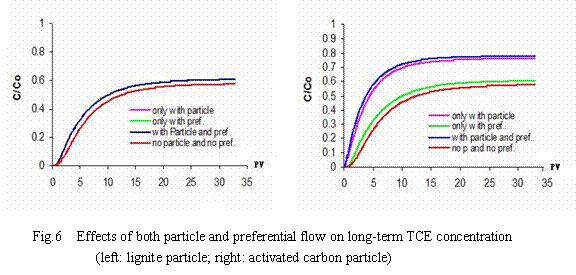
The breakthrough curves of some possible combinations of enhanced solute spreading
processes for lignite particles and activated carbon particles are shown in Fig.6. It can be seen that in the case of lignite particle-facilitated transport, the effect of coupled transport on long-term concentration mostly attribute to preferential flow. Unlike lignite particle-facilitated transport, the role of activated carbon particles is far beyond preferential flow. Effect of both particle-facilitated transport and preferential flow on a long-term concentration increases up to 5% for lignite particles and 20% for activated carbon particles. Quantitative data showing the percent change in total mobile mass are listed in Tab. 4.

Tab. 4: Comparison of total mobile mass change (%) for different particles due to some enhanced solute transport
Particle type | Coupled effect | Only due to particle | Only due to pref. flow |
lignite |
3.16 |
0.01 ( 1% ) |
3.15 ( 99% ) |
Activated carbon |
20.31 |
17.16 ( 88% ) |
1.83 ( 12% ) |
5 Conclusion
Only particles with higher sorption capacity can produce significant increase on a long-term contaminant concentration.
Higher fractions of preferential flow will lead to higher contaminant concentrations at the groundwater table.
From a long-term point of view, both effects of particle facilitation and preferential flow on the TCE concentration at the groundwater table could lead to a 5% increase for lignite particles and a 20% increase for activated carbonparticles. When preferential flow is < 10% in volume, the contribution of particle-facilitated transport to concentration is far beyond the contribution of preferential flow for activated carbon particles, but the situation is completely opposite for lignite particles.
Reference
[1] Bold, S., Kraft, S., Grathwohl, P., Liedl R., 2003. Sorption/desorption Kinetics of Contaminants on Mobile Particles: Modelling and Experimental Evidence, Water Resour. Res., 39(12), 1329, doi: 10. 1029/2002WR001798.
[2] Bold, S., 2004. Process-based prediction of the long-term risk of groundwater pollution by organic non-volatile contaminants. Ph.D. Thesis.
[3] Finkel, M. Liedl, R. and Teutsch, G., 1998. Modelling Reactive Transport of Organic Solutes in Groundwater with a Lagrangian Streamtube Approach. Geochemical Processes: Conceptual Models for Reactive Transport in Soil and Groundwater pp.115-133.
[4] Finkel, M., Bold S., Liedl, R. and Grathwohl, P., 2002. SMART Workshop Lecture Scripts.
[5] Fetter, C.W., 1993. Contaminant hydrogeology, Macmillan Publishing Company, New York.
[6] Grathwohl, P., 1998. Diffusion in natural porous media: Contaminant Transport, Sorption, Desorption and Dissolution Kinetics. Kluwer Academic Publishers, Boston.
[7] Grathwohl, P., and Kleineidam, S., 1995. Impact of heterogeneous aquifer materials on sorption capacities and sorption dynamics of organic contaminants, Groundwater Quality: Remediation and Protection: IAHS Publication 225.
[8] Grathwohl, P., and Reinhard, M., 1993. Desorption of trichloroethylene in aquifer material: Rate limitation at the grain scale. Environ. Sci. Technol., 27(12), 2360-2366.
[9] Kleineidam, S., Schüth, C., and Grathwohl, P., 2002. Solubility-Normalized combined adsorption-partitioning sorption isotherm for organic pollutants. ENVIRON. SCI. & TECHNOL in press.
[10] Kleineidam, S., Rügner, H. and Grathwohl, P., 1999. Impact of grain scale heterogeneity on slow sorption kinetics. Environmental Toxicology and Chemistry 18(8): 1673-1678.
[11] Kleineidam, S., Rügner, H., Ligouis, B., and Grathwohl, P., 1999. Organic matter facies and equilibrium sorption of phenanthrene. Environ.Sci. Technol 33:1637-1644.
[12] Karapanagioti, H.K., Grossard, C.M., Strevett, K.A., Kolar, R.L and D.A. Sabatini, 2001. Model coupling intraparticle diffusion/sorption, and biodegradation processes. J. Contam. Hydrol., 48, 1-21.
[13] Liedl, R., and Ptak, T., 2003. Modelling of diffusion-limited retardation of contaminants in hydraulically and lithologically nonuniform media. J. Contam. Hydrol., 66 (3-4), 239-259.
[14] Peter, A., 2002. Assessing natural attenuation at field scale by stochastic reactive transport modelling. Ph.D. Thesis.
[15] Privetz B.E., Kelsey J.W., Steenhuis T.S. and M. Alexander, 1996. A procedure to calculate biodegradation during preferential flow through heterogeneous soil columns. Soil Sci. Soc. Am. J. 60, 381-388.
[16] Rügner, H., Kleineidam, S. and P. Grathwohl, 1999: long term sorption kinetics of phenanthrene in aquifer materials. Environ. Sci. Tech. 33(10) 1645-1651.


 /sec)
/sec)
 )
)