


Achievements
ESTIMATING GROUNDWATER RECHARGE USING ARTIFICIAL TRACING TECHNIQUE IN HEBEI PLAIN
Wang Bingguo1,Jin Menggui1,Yang Lei1 ,Wang Wenfeng2
1.School of Environmental Studies,China University of Geosciences,Wuhan 430074,China;
2.Beijing Geotechnical Institute,Beijing 100038)
Abstract: Artificial tritium and bromide were used as tracers to determine diffuse groundwater recharge in Hebei Plain, North China, in order to evaluate the impacts of different soil type, land-use, irrigation, and crop cultivation practice on recharge. 40 sites at the representative zones were chosen to reveal spatial change rule of recharge rates. Recharge rates determined by artificial tritium and bromide tracing for different sites vary from 0.15 to 1.42mm/d. The results also indicate that the recharge rate of the former was bigger than the latter by comparing irrigation and no irrigation, normal irrigation(0.42-0.58 mm/d) and water-saving irrigation(0.17-0.23 mm/d), no stalk mulch(0.56-0.80 mm/d) and stalk mulch(0.44-0.60 mm/d), grape(1.42 mm/d), apple(1.07 mm/d) and cropland(0.49 mm/d), vegetable(0.70 mm/d) and cropland(0.38 mm/d), peanut(0.51 mm/d) and peach(0.43 mm/d). By contrasting the results of tritium and bromide tracing test, it shows that the recharge rate of bromide tracing was bigger than that of the tritium tracing. The reason was also analyzed and so it came to the conclusion that tritium tracing was better than the bromide tracing. Based on these, the applicability of the method was further discussed.
Key words Artificial tracing technique;Tritium;Bromide;Hebei plain;Groundwater recharge
0 Introduction
At present, many methods such as direct measurement, water-balance method, Darcian approach, tracer technique, water table fluctuation method and numerical simulation method were used to estimate groundwater recharge (Scanlon et al. 2002; Simmers 1997). Tracer technique was developed quickly in the late 2-3 decades. There are three basal types generally for tracer technique in estimating groundwater recharge rate and process (Edson 1998). They are applied tracer, history tracer, and environmental tracer. Chemical or isotopic tracers are applied as a pulse at the soil surface or at some depth within the soil profile to estimate recharge (Wood et al. 1995). Infiltration of precipitation or irrigation transports the tracer downwards to a depth. Commonly used tracers include bromide, 3H, and visible dyes (Kung 1990; Flury et al. 1994, Forrer et al. 1999). Many investigators use tritium as an artificial tracer to follow water movement(Athavale and Rangarajan 1988; Jin et al, 2000). It is part of a water molecule it moves with the water and is not subject to anion exclusion. On the other hand, its concentration may be affected by plant uptake. Also, it requires relatively expensive measurement equipment and its use may be prohibited by environmental protection laws. Bromide is widely used(Jury, et al. 1982; Rice, et al. 1986; Sharma, et al. 1987; Hendrickx, et al. 1993) because: 1. Its background concentration is negligible in most environments; 2. It is very mobile and its behavior is very similar to that for nitrates and chlorides; 3. It is relatively cheap and easy to detect. It was also previously assumed that bromide was not taken up by vegetation and agricultural crops, but this assumption has been proved to be false (Kung, 1990).Historical tracers result from human activities or events in the past, such as contaminant spills (Nativ et al. 1995) or atmospheric nuclear testing (3H and 36Cl). These historical tracers or event markers are used to estimate recharge rates during the past 50 years (Allison et al. 1978, 1983, 1994; Scanlon 1992, 2000; Cook et al. 1994). Industrial and agricultural sources produce contaminants such as bromide, nitrate, atrazine, and arsenic, and these can provide qualitative evidence of recent recharge; however, uncertainties with respect to source location, concentration, and timing of contamination, as well as possible nonconservative behavior of contaminants, make it difficult to quantify recharge. Environmental tracers such as chloride (Cl) are produced naturally in the Earth’s atmosphere and are used to estimate recharge rates (Phillips 1994; Scanlon 2000). Here are results from the artificial tracing tests with tritium and bromide.
1 Background of the Research Area
Hebei Plain,
adjacent to Beijing and Tianjin
municipalities, is part of the Huang-Huai-Hai Catchment Plain in
Obviously water shortage is a bottleneck of the agricultural development in the area. Strategically, the key issue is to optimally develop and manage the limited water resources in the region such that they can be used on a sustainable basis. This requires a more precise determination and regulation of the agricultural and industrial requirement regimes within a framework of present resource availability and environmental constraints. Current water-saving agricultural practices in the area certainly impact on soil moisture regime and recharge processes and are directly reflected by differences in net groundwater recharge (Jin et al. 1998, 2000).
According to the hydrogeological conditions and groundwater system character, some representative zones from the piedmont to coastal plain were selected for particular research. They are Shijiazhuang representative zone (including Luquan, Luancheng, and Xinji) in piedmont plain, Hengshui and Dezhou representative zone in alluvial and lacustrine plain, and Cangzhou representative zone in coastal plain (Figure 1). General of the representative zones was listed in Table 1 as follows.
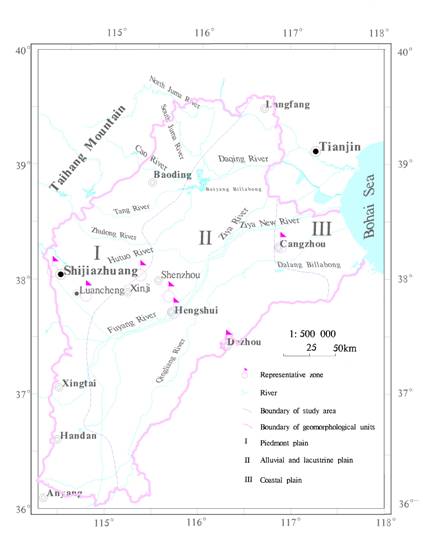
Figure 1: Map of Hebei Plain
2 Principles and Methods
The procedure for determining groundwater recharge by artificial tritium tracing (Jin et al, 2000) is: Inject tritiated water to a known depth, monitor changes in tritium of soil water in profiles by sampling, calculate the vertical percolating velocity (v) of soil water by observing the downward movement (Dz) of the tritium peaks, then calculate groundwater recharge R from:
R= vq = qDz/Dt
Where Dt is the duration of tritium injection and
sampling; and q is the average soil water content in Dt over the depth Dz.
Profiles were established at each site for sampling one/two times. For each profile three holes were drilled by hand auger, the holes being located at the apex of a 10 cm triangle; each hole was 2 cm in diameter and 100 cm in depth. 30-ml of tritiated water was injected at this depth of 100cm though a canaliculus. At the centre of the triangle a PVC tube as a marker was buried to 40 cm below ground surface to locate the sample position.
Table 1: General of the representative zone
|
Geomorphological setting |
Representative zone |
Location |
Water table depth (m) |
Soil lithology |
Mean rainfall(mm/a) | |
|
Alluvial and pluvial/ diluvial plain |
|
Huolu, luquan county |
10-15 |
silt clay and silt |
547 | |
|
Niejiazhuang, Luancheng county |
30-35 |
clay and silt |
537 | |||
|
Jiucheng, Xinji county |
25-30 |
silt |
520 | |||
|
Alluvial and lacustrine plain |
Hengshui |
Hujiachi, Shenzhou county |
10-15 |
clay |
511.1 | |
|
Experimental ground of agriculture, Taocheng region |
1-3 |
clay and silt clay |
511.1 | |||
|
Dezhou |
|
1-4 |
silt clay |
522.3 | ||
|
|
2-4 |
silt |
522.3 | |||
|
Alluvial and coastal plain |
Cangzhou |
Xiaozhaozhuang, Cangzhou county |
1-4 |
silt |
554.3 |
When sampling after the rainy season one must
first locate the PVC marker, then soil was sampled. The sampling depth was from
1.0m to water table (or
to 5.0m). The sampling depth
interval was every 10 cm
from 1.0m to 2.0m and 20cm below 2.0m.
Each soil sample was about 200 g
and was packed in a plastic bag to avoid evaporation. As
soon as the samples arrived in laboratory, soil water was extracted from of
each collected by oil bath distillation at 130oC. And then the water
was delivered and tested by Liquid
Scintillation Analyzer(model: Tri-Carb 3170 TR/SL) in
Bromide injecting and sampling was as same as that of the tritium. But the samples are dried in the natural conditions, triturated and filtered by 1mm sizer.
Thereafter, 500ml of deionised water is added to 50 g of filtered sample and shaken for 2 hours. The mixture is then allowed to settle for 24 hours. The resulting solution is filtered through a 0.45 μm Millipore membrane filter and stored in a 596 ml polyethylene bottle. And then it is analyzed by ion electrode method.
Tritium and bromide were injected at 23 sites on August 17-24 and November 3-11, 2003 and sampled at September 21-29, 2004 and September 22-28, 2005. Each site represented a different type of soil, land use, irrigation and crop cultivation practice (Table 2 and Table 3).
Table 2: Summary of tritium and bromide tracing points(sampled at September 21-29, 2004)
|
Locations |
Number |
Soil lithology |
Land use type |
Injection date |
Sampling date |
Memo |
|
Xiaozhaozhuang ,Cangzhou county |
CZ11 |
silt |
wilderness |
03-8-22 |
04-9-21 | |
|
CZ13 |
wheat-maize |
03-8-22 |
04-9-21 | |||
|
CZ61 |
apple |
03-11-6 |
04-9-22 | |||
|
Chenzhuang, Dezhou county |
DZ16* |
silt clay |
wilderness |
03-8-23 |
04-9-23 | |
|
DZ17* |
maize-cotton |
03-8-23 |
04-9-23 | |||
|
Songguantun, Dezhou county |
DZ41 |
silt |
cotton |
03-11-5 |
04-9-23 | |
|
DZ42 |
apple |
03-11-5 |
04-9-23 | |||
|
DZ43 |
wheat-maize |
03-11-5 |
04-9-23 | |||
|
Taocheng region, hengshuicounty |
HS19 |
clay and silt clay |
wilderness |
03-8-24 |
04-9-25 | |
|
HS21 |
maize |
03-8-24 |
04-9-25 | |||
|
HS23* |
wheat-maize |
03-11-3 |
04-9-25 |
organic fertilizer | ||
|
HS25* |
wheat-maize |
03-11-3 |
04-9-25 |
normal | ||
|
HS27 |
wheat-maize |
03-11-3 |
04-9-25 |
chemical fertilizer | ||
|
Niejiazhuang, Luancheng county |
LC05* |
clay and silt |
wheat-maize |
03-8-20 |
04-9-28 |
sprinkling irrigation |
|
LC07* |
wheat-maize |
03-8-20 |
04-9-28 |
normal irrigation | ||
|
LC10* |
wilderness |
03-8-20 |
04-9-29 | |||
|
LC82* |
wheat-maize |
03-11-9 |
04-9-28 |
Stalk mulch | ||
|
LC84* |
wheat-maize |
03-11-9 |
04-9-28 |
no stalk mulch | ||
|
Huolu, luquan county |
LQ02 |
silt clay and silt |
maize |
03-8-17 |
04-9-27 | |
|
LQ03 |
wilderness |
03-8-17 |
04-9-27 | |||
|
LQ71* |
apple |
03-11-8 |
04-9-26 | |||
|
LQ72* |
grape |
03-11-8 |
04-9-26 | |||
|
LQ73 |
wheat-maize |
03-11-8 |
04-9-26 |
3 Results and Discussions
All of tritium and bromide profiles are shown in Figures 2 through 31 and the recharge rates are summarized in Table 4 and Table 5. Recharge rates determined by artificial tritium tracing for different sites varied from 0.15 to 1.42mm/d, though an additional bypass component is considered likely. The demonstrated spatial variability in recharge reflects different crops, cultivation practices, irrigation regimes and soil types. (1) Irrigation will naturally result in more groundwater recharge by a comparison of irrigation cropland and no irrigation wilderness for site CZ11 and CZ13, CZ12 and CZ14, DZ16 and DZ17, LC07 and
LC10 , LC81 and LC85 (for LQ02 and LQ03, because LQ03 located in the depression and inundated; for SZ151 and SZ152, because SZ152 was flooded by well-drilling slurry), and water-saving irrigation may reduce recharge by a comparison of sites LC05 and LC07, LC06 and LC08; (2) Different land use may result in different recharge rate. The orchards may benefit recharge (cf. LQ 71, LQ 72 and LQ 73), and the recharge rate for grape-planting is bigger than that of apple-planting. The recharge rate for peanut is bigger than that of peach (cf. XJ200 and XJ202) and the recharge rate for vegetable is bigger than that of crop (cf. CZ66 and CZ68); (3) coarse soil may result in more groundwater recharge (cf. CZ11, DZ16, DZ41); and (4) straw mulch will reduce recharge (cf. LC82 and LC84, LC83 and LC85).
Table 3: Summary of tritium and bromide tracing points(sampled at September 22-28, 2005)
|
Locations |
Number |
Soil lithology |
Land use type |
Injection date |
Sampling date |
Memo |
|
Xiaozhaozhuang,Cangzhou county |
CZ12 |
silt |
wilderness |
03-8-22 |
05-9-28 | |
|
CZ14 |
wheat-maize |
03-8-22 |
05-9-28 | |||
|
CZ65 |
wilderness |
04-5-20 |
05-9-28 | |||
|
CZ66 |
vegetable |
04-5-20 |
05-9-28 | |||
|
CZ68 |
wheat-maize |
04-5-20 |
05-9-28 | |||
|
Chenzhuang, Dezhou county |
DZ18 |
silt clay |
maize-cotton |
03-8-23 |
05-9-27 | |
|
Jiucheng, Xinji county |
XJ200 |
silt |
peanut |
04-5-27 |
05-9-25 | |
|
XJ202 |
peach |
04-5-27 |
05-9-25 | |||
|
Hujiachi, Shenzhou county |
SZ151 |
clay and silt clay |
wheat-maize |
04-5-27 |
05-9-26 | |
|
SZ152 |
wilderness |
04-5-27 |
05-9-26 | |||
|
Niejiazhuang, Luancheng county |
LC06 |
silt clay |
wheat-maize |
03-8-20 |
05-9-22 |
sprinkling irrigation |
|
LC08 |
wheat-maize |
03-8-20 |
05-9-22 |
normal irrigation | ||
|
LC81 |
wilderness |
03-11-9 |
05-9-22 | |||
|
LC83 |
wheat-maize |
03-11-9 |
05-9-23 |
Stalk mulch | ||
|
LC85 |
wheat-maize |
03-11-9 |
05-9-23 |
no mulch | ||
|
LC88 |
wheat-maize |
04-5-25 |
05-9-22 |
no fertilizer | ||
|
Huolu, luquan county |
LQ01 |
silt clay and silt |
maize-wheat |
03-8-17 |
05-9-24 |
By contrasting the results of tritium and bromide tracing test (Table 4 and Table 5),it indicates that the groundwater recharge rates of bromide tracing were bigger than that of the tritium tracing. It demonstrated the bromide moved approximately 24% faster than the tritiated water and the lagging of the tritiated water behind the bromide may be a result of anion exclusion 3. Hence, the result of tritium tracing is better than that of the bromide tracing. But the cost of tritium testing is much higher than the bromide.
The result also indicates some representative zones as Hengshui, Dezhou, and Cangzhou may be not applicable for using this method (figures 11 to 17) because of shallow water table. In that case, soil water movement was sharply affected by water table. Soil water was downward for precipitation and irrigation, and upward for evapotranspiration, so that the tracers moved up and down with the soil water, which may result in uncertainty. Therefore, this artificial tracing method is not fit for shallow water table.
Fig.30 Bromide tracing
profile for site CZ66 Fig.31 Bromide tracing
profile for site CZ68
In addition, the result may indicate that bypass flow recharge exists in the area(figure 26). Tritium tracer method can only determine diffuse recharge so that we do need alternative methods to determine bypass flow recharge.
Table 4 Summary of recharge rate determined by tritium or bromine tracing(sampled at September 21-29, 2004)
|
Number |
ΔZ(cm) |
θ (%) |
△t (d) |
Precipitation (mm) |
Irrigation (mm) |
R(mm/d) | ||
|
3H |
Br- |
3H |
Br- | |||||
|
CZ11 |
30 |
- |
35.3 |
396 |
757.8 |
0 |
0.27 |
- |
|
CZ13 |
40 |
- |
30.5 |
396 |
757.8 |
150 |
0.31 |
- |
|
CZ61 |
0 |
- |
321 |
452.6 |
150 |
- | ||
|
DZ16* |
20 |
20 |
30.4 |
397 |
722.6 |
0 |
0.15 |
0.15 |
|
DZ17* |
80 |
80 |
32.2 |
397 |
722.6 |
90 |
0.65 |
0.65 |
|
DZ41 |
50 |
- |
29.7 |
323 |
455.1 |
0 |
0.46 |
- |
|
DZ42 |
0 |
- |
323 |
455.1 |
75 |
- |
- | |
|
DZ43 |
0 |
- |
323 |
455.1 |
225 |
- |
- | |
|
HS19 |
0 |
- |
398 |
593.0 |
0 |
- |
- | |
|
HS21 |
0 |
- |
398 |
593.0 |
0 |
- |
- | |
|
HS23* |
10 |
0 |
327 |
379.1 |
225 |
- |
- | |
|
HS25* |
10 |
0 |
327 |
379.1 |
225 |
- |
- | |
|
HS27 |
0 |
- |
327 |
379.1 |
225 |
- |
- | |
|
LC05* |
30 |
40 |
30.7 |
405 |
701.7 |
158 |
0.23 |
0.30 |
|
LC07* |
70 |
80 |
33.8 |
405 |
701.7 |
300 |
0.58 |
0.67 |
|
LC10* |
40 |
60 |
33.0 |
406 |
701.7 |
0 |
0.32 |
0.49 |
|
LC82* |
60 |
60 |
32.2 |
324 |
500.6 |
300 |
0.60 |
0.60 |
|
LC84* |
80 |
130 |
32.5 |
324 |
500.6 |
300 |
0.80 |
1.30 |
|
LQ02 |
50 |
- |
33.3 |
407 |
814 |
75 |
0.41 |
- |
|
LQ03 |
150 |
- |
26.4 |
407 |
814 |
0 |
0.97 |
- |
|
LQ71* |
110 |
110 |
31.5 |
323 |
538 |
150 |
1.07 |
1.07 |
|
LQ72* |
150 |
230 |
30.7 |
323 |
538 |
150 |
1.42 |
2.18 |
|
LQ73 |
50 |
- |
31.7 |
323 |
538 |
225 |
0.49 |
- |
Note:* showing tracer test of tritium and bromide
Table 5 Summary of recharge rate determined by tritium or bromine tracing(sampled at September 22-28, 2005)
|
Number |
ΔZ(cm) |
θ (%) |
△t (d) |
Precipitation (mm) |
Irrigation (mm) |
R(mm/d) | ||
|
3H |
Br- |
3H |
Br- | |||||
|
CZ12 |
50 |
- |
37.2 |
768 |
1357 |
0 |
0.24 |
- |
|
CZ14 |
70 |
- |
31.9 |
768 |
1357 |
450 |
0.29 |
- |
|
CZ65 |
- |
30 |
34.5 |
496 |
910 |
0 |
- |
0.21 |
|
CZ66 |
- |
105 |
33.1 |
496 |
910 |
1070 |
- |
0.70 |
|
CZ68 |
- |
57 |
32.9 |
496 |
910 |
270 |
- |
0.38 |
|
DZ18* |
80 |
110 |
35.0 |
766 |
1333 |
90 |
0.37 |
0.50 |
|
XJ200 |
- |
168 |
14.9 |
486 |
890 |
600 |
- |
0.51 |
|
XJ202 |
- |
142 |
14.8 |
486 |
890 |
600 |
- |
0.43 |
|
SZ151 |
- |
47 |
37.2 |
487 |
890 |
375 |
- |
0.36 |
|
SZ152 |
- |
50 |
39.1 |
487 |
890 |
0 |
- |
0.40 |
|
LC06* |
50 |
60 |
25.7 |
764 |
1135 |
458 |
0.17 |
0.20 |
|
LC08* |
90 |
90 |
35.7 |
764 |
1135 |
675 |
0.42 |
0.42 |
|
LC81* |
50 |
50 |
29.6 |
683 |
934 |
0 |
0.22 |
0.22 |
|
LC83* |
90 |
110 |
33.2 |
684 |
934 |
675 |
0.44 |
0.53 |
|
LC85* |
120 |
190 |
32.1 |
684 |
934 |
675 |
0.56 |
0.89 |
|
LC88 |
- |
75 |
29.8 |
485 |
833 |
300 |
- |
0.46 |
|
LQ01 |
110 |
- |
33.3 |
769 |
1135 |
450 |
0.48 |
- |
Note:* showing tracer test of tritium and bromide; SZ152 was flooded by well-drilling slurry.
4 Conclusions
Recharge rates determined by artificial tritium tracing for different sites varied from 0.15 to 1.42mm/d, though an additional bypass component is considered likely. The demonstrated spatial variability in recharge reflects the different crops, cultivation practices, irrigation regimes and soil types. (1) Irrigation will naturally result in more groundwater recharge by contrasting irrigation cropland and no irrigation wilderness and water-saving irrigation may reduce recharge by a comparison of sites LC05 and LC07, LC06 and LC08; (2) Different land use may result in different recharge rate. The orchards may benefit recharge (cf. LQ 71, LQ 72 and LQ 73), and the
recharge rate for grape-planting is bigger than that of apple-planting. The recharge rate for peanut is bigger than that of peach (cf. XJ200 and XJ202) and the recharge rate for vegetable is bigger than that of crop (cf. CZ66 and CZ68); (3) coarse soil may be result in more groundwater recharge (cf. CZ11、DZ16、DZ41); and (4) straw mulch will reduce recharge (cf. LC82 and LC84, LC83 and LC85). Contrasting the results of tritium and bromide tracing demonstrated the bromide moved approximately 24% faster than the tritiated water and the lagging of the tritiated water behind the bromide may be a result of anion exclusion. The result also indicates the method is not fit for shallow water table.
Acknowledgements
The authors gratefully acknowledge the financial support by the China of Geology Survey(200310400035-1), the National Science Foundation of China (40472123) and the Research Foundation for Outstanding Young Teachers, China University of Geosciences(Wuhan)(CUGQNL0631).
References
[1] Allison G.B., Hughes M.W. 1978. The use of environmental chloride and tritium to estimate total recharge to an unconfined aquifer. Aust Journal Soil Res 16:181–195
[2] Allison G.B., Hughes M.W. 1983. The use of natural tracers as indicators of soil-water movement in a temperate semi-arid region. Hydrogeology Journal 60:157–173
[3] Allison G.B., Gee G.W. and Tyler S.W. 1994. Vadose
zone techniques for estimating groundwater recharge in arid and semiarid
regions. Soil Science Society of
[4] Athavale R.N., Rangarajan R. 1988. Natural recharge
measurements in the hard-rock regions of semi-arid
[5] Cook P.G., Jolly I.D., Leaney F.W., Walker G.R.
1994. Unsaturated zone tritium and chlorine 36 profiles from southern
[6] Edson T.D.. 1998.Tracer studies and groundwater recharge assessment in the eastern fringe of the Botswana Kalahari. Printing & Publishing Company Botswana(Pty) Limited:Gaborone, Botswana.19-26
[7] Flury M., Fluhler H., Jury W.A., Leuenberger J. 1994. Susceptibility of soils to preferential flow of water: a field study. Water Resources Research, 30:1945–1954
[8]
[9] Hendrickx JMH, Dekker L.W., Boersma O.H. 1993. Unstable wetting fronts in water-repellent field soils. J Environ Qual 22:109–118
[10] Jin, Menggui, Ian Simmers, Renquan Zhang, 2000.
Estimation of Groundwater Recharge at
[11] Jin, Menggui, Xing Liang, Ian Simmers, Yunfu Gao
and Renquan Zhang, 2000. Estimation of groundwater recharge using artificial
tritium tracing. Proceedings of the International Symposium on Hydrogeology and
the Environment.
[12]
Jin Menggui,
Simmers Ian and Zhang Renquan. Preliminary Estimation of Groundwater Recharge
at
[13] Jury W.A., Stolzy L.H., Shous P., 1982. A field test of the transfer function model for predicting solute movement. Water Resources Research 18:369–375
[14] Kung K.J. 1990. Influence of plant uptake on the
performance of bromide tracer. Soil Science Society of
[15] Nativ R., Adar E., Dahan O., Geyh M. 1995. Water recharge and solute transport through the vadose zone of fractured chalk under desert conditions. Water Resources Research, 31:253–261
[16]
Phillips F.M.
1994. Environmental tracers for water movement in desert soils of the American
Southwest. Soil Science Society of
[17] Porro I., Wierenga P.J. 1993. Transient and steady-state solute transport through a large unsaturated soil column. Ground Water, 31(2):193-200
[18] Rice R.C., Bowman
R.S., Jaynes D.B. 1986. Percolation of water below an irrigated field. Soil Science
Society of
[19] Scanlon B.R. 1992. Evaluation of liquid and vapor flow in desert soils based on chlorine-36 and tritium tracers and nonisothermal flow simulations. Water Resources Research, 28:285–297
[20] Scanlon B.R. 2000. Uncertainties in estimating water fluxes and residence times using environmental tracers in an arid unsaturated zone. Water Resources Research, 36:395–409
[21] Scanlon B.R., Healy R.W. and Cook P.G.. 2002. Choosing appropriate techniques for quantifying groundwater recharge. Hydrogeology Journal.10(1):18-39
[22] Sharma M.L., Watson J.D., Cresswell I.D. 1987.
Estimation of areal recharge using a non-reactive chemical tracer. In: Fok Y-S
(ed) Infiltration-principles and practices. University
of Hawaii,
[23] Simmers I.
(ed.).1997. Recharge of phreatic aquifers in (semi-)arid areas. IAH
International Contributions to Hydrogeology, Vol.19, A.A. Balkema,
[24] Wood W.W.,