


Achievements
FLOW AND TRANSPORT MATHEMATICAL MODELLING IN ORDER TO ESTABLISH THE HYDRIC RESOURCES MANAGEMENT IN THE OASIS OF FIGUIG (MOROCCO)
D. PUIGSERVER, J Mª CARMONA, M. HIMI & A. CASAS
Departament de Geoquímica Petrologia i Prospecció Geològica. Grup de Geologia Econòmica i Ambiental i Hidrologia. Facultat de Geologia. Universitat de Barcelona. C/ Martí i Franquès s/n. 08028 BARCELONA.
Abstract: The Oasis of Figuig, located in the eastern end of the Moroccan High Atlas, constitutes a clear paradigm of the developing societies where extreme climatic conditions and water shortages have favoured emigration and incoming capital. This has contributed to an agricultural development that favours an overexploitation of water resources. Conceptual flow and transport model of the system was derived from the hydrogeological and geophysical studies that showed the existence of an increase in the salinity of waters as a result of the recycled irrigation waters. This increase is especially well known towards the south of the system, because of the existence of a barrier to the horizontal flow that induces a vertical flow and a stagnation of waters. In order to improve the previous conceptual model, to characterize the flow throughout the fractures, and to visualize the hydraulic functioning of the system a numerical flow and transport model has been constructed. The model has been used to study the evolution of the anthropic salinization during the period between 1960 and 2002. It states that to the south of the system this salinization diminishes with the depth and that the low velocity of the flow favours the diffusive transport throughout the aquifer formation. In contrast, the advective transport through the faults.
Key words: Flow and transport numerical model, soil and water salinization, overexploitation, deep-water circulation, hydric resources management and Morocco
Introduction and Background Information
The Oasis of Figuig is located in the desert territory of the eastern end of the High Moroccan Atlas in the border zone between Morocco and Algeria, 32 ºN latitude and 2º W longitude. The surface of the studied region is 450 km2 although the area, where majority of studies have been carried out, is the agricultural zone of the Oasis and its extensions (Tisserfine and Arja), and represents 55 km2 (Figure 1).
The oasis exists due to the geological configuration and morphologic and climatic factors. Since the prehistoric times numerous agricultural communities have been established that have modelled the characteristic of the oasian ecosystem. In addition these communities are an example of developing societies where extreme climatic conditions and shortages of resources have favoured the emigration and the depopulation of their territory. Despite this emigration, the increase in the introduction of currencies has been favoured as well as an agricultural development of the population in Figuig and their surroundings (Bencherifa and Popp, 1990 a and b). Nevertheless this development was not preceded of a management planning of the limited hydric resources. This has favoured a disturbed growth in the number of wells, and has contributed to the overexploitation and quality deterioration of groundwater.
Different studies were done related to the available hydric resources as the main problem that exists in the Oasis. These studies were emphasized in the PhD thesis of Zaid (1984) on the Oasis of Figuig, in the studies of soil and water salinization in Figuig by Jungfer et. al. (1989) and Jungfer (1990), and in the Bencherifa and Popp (1990) study on the Figuig’s palm and their hydric resources. Important hydrogeological contributions were made by the DRH (1995), during the different field campaigns of hydrogeological and geophysical recognition carried out by the members of the Department of Geochemistry, Petrology and Geological Exploration of the University of Barcelona between 1999 and 2002, and in the studies of Puigserver (2001) and Puigserver (2004).
The main problems that appear in the oasis are the progressive increase of water demand in agriculture and the progressive decrease of the recharge of the system that favours the diminution of the regulated resources and salinization of soil and shallow hydrogeological formation because the reinfiltration of irrigation water return.
All these studies have contributed to the construction of a flow and transport modelling with the Visual ModFlow Pro 2.8.2.52 program from USGS.
The main purpose of the mathematical modelling is to serve as a management tool of the hydric resources of the Oasis. In order to develop this tool we proposed more specific objectives such as: to validate and to complete the conceptual model of flow and transport, to incorporate all the information available in a GIS (Miramon), to evaluate the temporary water level evolution based on the recharge, and to analyse the chloride transport throughout the modelled zone in order to obtain data on the vulnerability of the system. In this sense it was attempted to determine the new municipal landfill impact on the hydrogeological formation.
From the geologic point of view, the studied region is marked by two important facts:
- Structurally this region is dominated by a succession of anticlines and synclines whose directions are E-W or ENE-WSW, with a generalized inclination of their axes towards E, and with numerous faults of variable direction that cross the structure (Breil et. al., 1977).
The anticlines, vergent towards the S and tighten a lot, give rise to important relief, whereas the synclines, which are very lax, are covered by quaternary materials forming extensive plains.
The stratigraphic series can be described as follows: in the bottom of the series are low hydraulic conductivity red marls and evaporitic triasic materials. These materials, which often act as a take off level for horizontal faults, arise in the anticlines nucleus and form diapiric structures that give pronounced geophysical gravimetric minimum anomalies (Carmona et. al., 2001). Above the Triassic materials, which arise in the slopes of the relief, there are the Lias materials, constituted by limestones, dolostones and marls with a thickness of 200 m and that display between 3-9 m/day of hydraulic conductivity and storage coefficients between 1·10-5 and 1·10-6. The values of these hydraulic parameters have been estimated using pumping tests and a calibration mathematical model (Puigserver 2004). Dogger, with thicknesses varying between 200-400 m, arises in the relief located to the NE and the S of the oasis (Figure 1). The main materials are marls and blue limestones of the Bajocien and black sandstone of the Bathonien that display hydraulic conductivities between 0.5 to 3 m/day.
Reliefs located to the S are crossed by an inverse fault that constitutes the more meridional south-atlasic overthrust (Figure 1). This overthrust is probably the surface manifestation of a subhorizontal listric fault that must exist deep below (Carmona et. al, 2001). The overthrust puts in contact the Dogger materials in the N with Jurassic-Cretaceous sandstone located in Algerian territory, in the S. These materials, with low hydraulic conductivity, act as a horizontal flow barrier (Breil et. al, 1977).
The Quaternary materials form the plains, and are constituted by alluvial fan materials, aeolian sands with pebble in different evolutionary stages, travertine and silt. In these plains date palms constitute the most important agricultural resource of the oasis.
The limestones are fissurated and display different karstification degrees and forms a hydrogeological unit associated with a regional flow in the general direction W-E. In the south-eastern part of the studied region, where there is the south-atlasic overthrust, the presence of the impermeable cretaceous materials and the subvertical faults that cross the formation, favour an ascending vertical flow (Breil et.al, 1977 and Carmona et. al, 2001). One of these faults, called Figuig’s fault, with ENE-WSW direction, has35 geothermal sources that feed the oasis.
In addition to the listric fault, two groups of faults can be distinguished (Figure 1):
- Direction faults (NE-SW): There are inverse faults that dip in NW direction and cross the aquifer formation. Between them there are the Figuig’s fault and south-atlasic overthrust (Puigserver 2001 and Carmona et. al., 2001)
- Subvertical faults (NW-SE): These faults cut all the previous ones as well as the listric fault. They act as drainage lines for the aquifer system and in them torrential stream can flow (Puigserver 2004).
The conceptual model, in which the mathematical model has been based, takes into consideration that the aquifer system is in a folded geologic formation and is intensely fractured. This kind of geological structure determines the regional and local flow.
Regional circulation takes place through the folded materials and is predominantly horizontal. Simultaneously, there is vertical flow across the faults.
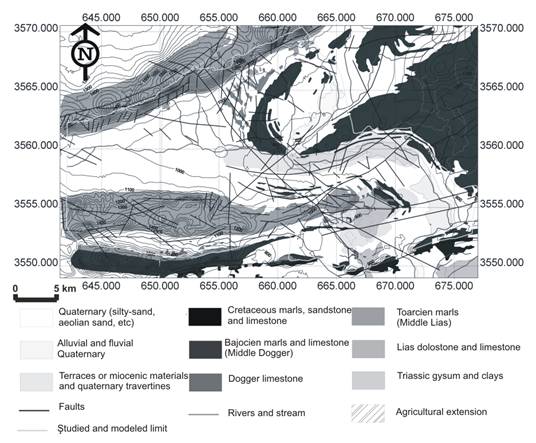
Fig 1: Geological map of the studied region.
Aquifer formations are constituted by fractured and/or karstificated carbonated materials. This explains why in the Tisserfine zone the regional flow is from W-E to NW-SE, whereas from the Arja zone until the most southern overthrust the main direction of flow is NW-SE. The presence of faults that cross the aquifer formation, favour a vertical flow. The directional faults NE-SW, e.g. Figuig’s fault, cross all of the aquifer formations and connect with the listric fault, favour an ascending vertical flow and the flows between confined formations. Whereas the subvertical faults from NW-SE cut the previous ones and permit the drainage of the aquifer system (Puigserver, 2004).
The main inputs of the system are the infiltration recharge, especially in the zones where relief is constituted mainly by calcareous Liasic materials (Jbel Maiz and Jbel Grouz mountanins), and the lateral flows coming from W and NE.
The main outputs of the system are towards the Algerian territory in the south and are favoured because of the listric fault verticalization. In this area the Dogger limestones are in contact with impermeable Cretaceous sandstone and act as a hydraulic barrier to the horizontal flow. This permits an increase of the vertical component of the flow of the deep circulating waters. The deep water is characterized by high electric conductivities and sodium-chlorided hydrochemical facies. This water also progressively increases the Sr, U, V, Pb, Rb and Li concentrations. All these observations demonstrate that this water is drainage from impermeable Triassic substratum which consists of detrical and evaporitic materials. Other outputs are the flow through the subvertical faults, the surface flow, flow through geothermal sources and flow to the Zousfana River starting at the Arja zone (Puigserver, 2001 and Carmona et. al, 2001).
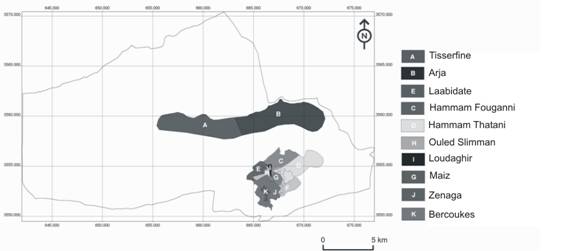
Fig 2: Agricultural zones.
Hydrochemical and water level data in the Figuig fault zone showed the existence of a piezometric dome that favours the output of the system through the geothermal water sources. Detailed study of the deep waters showed that those geothermal sources have less mineralization than southern waters despite having the same hydrochemical facies.
The flow through the fault is a combination of the total mixture and piston flow models as demonstrated by the isotope composition of the water sources (Puigserver 2001). In the Figuig fault it is observed that towards the western sector the temperature diminishes, the electrical conductivity, Eh and mineralization increase, the flow rate of the geothermal sources diminishes and the water becomes progressively enriched in heavy isotopes. This observation suggests that in this sector of the fault, the waters of the sources were mixed with meteoric water that are infiltrated throughout the plain of Figuig. Also, in this sector the water displays an increase in rNa+/rK+ and in the saturation index of Albite, Barite, Calcite, Dolomite, Gypsum, Goethite, Hematite, Illite, K-Feldspat and Quartz.
In relation to the main interaction water-rock mechanisms, it is necessary to emphasize the existence of cationic exchange between Na+ and Ca2+. In the Zenaga and Bercoukes zones (Figure 2) groundwaters show high electrical conductivities, increasing rCa2+/rCl-, decreasing rNa+/rCl-, icb becomes more positive and at the same time are progressively heavier (enriched in 18O and 2H). These processes are produced by the irrigation water evaporation and later reinfiltration, which cause isotopic fractionation. There are also some interchange processes between K+ and Na+ as a result of the preferred K+ fixation on the clays.
Methodology
The resolution of the flow and transport equations was made with finite difference method using the Visual ModFlow Pro 2.8.2.52 program. The mathematical model, that was constructed, was based mostly on the conceptual model from the hydrochemical and isotopic study (Puigserver, 2001).
During the first stage, the main limits of the model were defined to agree with the catchment area, whereas the south limit corresponds with the more southern-atlasic fault and the aquifer system and has been discretized in the space and time. The square mesh (500·500 m) was constructed with 111 rows and 91 columns (Figure 3). This mesh was oriented following the main direction of flow with a 338º rotation angle. The mesh was
later refined in the zones where the pumping wells were concentrated. The time discretization presents a total period of 15706 days and stress periods of 30-31 days.
Table 1: Main characteristics of the layers of the model.
|
Hydraulic parameters |
Transport parameters | |||||||
|
Layer |
Type of layer |
Lithology |
K (m/day) |
Ss (m-1) |
Sy |
Pe |
Pt |
Dx |
|
Layer 1 |
Type 0 |
Alluvial |
Kx=Ky=Kz=20 |
0.0095 |
0.4 |
0.2 |
0.4 |
3 |
|
Layer 2 |
Type 2 |
Quaternary silty sand |
Kx=Ky=Kz=0.05 |
0.00026 |
0.2 |
0.05 |
0.4 |
0.03 |
|
Layer 3 |
Type 3 |
Bajocien marl and limestone |
Kx=Ky=1 Kz=0.5 |
0.00014 |
0.14 |
0.005 |
0.4 |
0.08 |
|
Layer 4 |
Type 3 |
Dogger limestone |
Kx=Ky=3 Kz=1.5 |
0.0003 |
0.3 |
0.01 |
0.4 |
200 |
|
Layer 5 |
Type 3 |
Toercian marls |
Kx=Ky=0.004 Kz=0.002 |
0.00014 |
0.14 |
0.005 |
0.4 |
0.01 |
|
Layer 6 |
Type 3 |
Lias dolomestone-limestone |
Kx=Ky=9 Kz=3 |
0.00015 |
0.15 |
0.01 |
0.4 |
50 |
|
Layer 7 |
Type 3 |
Triassic clay |
Kx=Ky=0.003 Kz=0.0015 |
0.00026 |
0.2 |
0.005 |
0.4 |
0.03 |
|
Layer 8 |
Type 3 |
Listric fault |
Kx=Ky=1 Kz=0.5 |
0.00028 |
0.28 |
0.01 |
0.4 |
0.01 |
In order to reproduce the aquifer system, eight layers were considered and include the totality of the surface of the model. Table 1 shows the geometry, the dimensions and the tectonic structure of every layer. The faults of the model are connected geologically and hydraulically with the listric fault (layer 8) and they were implemented with lateral displacement of hydraulic characteristics throughout the layers in order to reproduce their dip. They are designed to present an influence zone that oscillates between 750 and 1000 m and increasing hydraulic conductivity towards the centre of the fault. The subvertical fault displays a constant hydraulic conductivity and a smaller influence area.
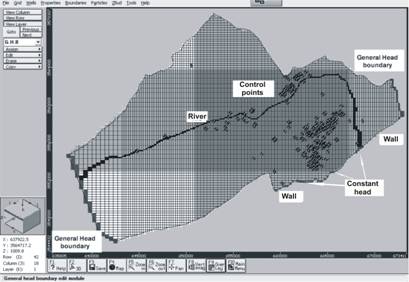
Fig 3: Modelled zone, square mesh, boundary conditions and control points in the mathematical model.
In the second phase, the main boundary conditions have been implemented (Figure 3). They consist of nonflow in the limits of the model, constant head (CHB), general head (GHB), drain boundary, walls, river, recharge, constant concentration (CC), recharge concentration (RC) and point source.
The CHB has been implemented in the south of the system where an outflow towards the Algerian territory exists through the Oued Zousfana River and through the NW-SE directional fault. The GHB has been implemented to simulate the lateral input flow to layers 4, 6 and 8. Table 2 shows the levels and conductances implemented that permit the existence of a regional vertical gradient.
The drain has been used to simulate the foggaras (water mines located at different depths and draining the geothermal sources) that are distributed throughout the Figuig’s fault. The wall was implemented in the zone corresponding to the south-atlasic overthrust in order to favour the vertical flow throughout it, with a thickness of 100 m and 9·10-10 m/day.
The overall recharge, the sum of natural recharge and water returns (reinfiltrated excesses of irrigation, losses of the networks of sewage and supply system), was implemented in the first layer with the option to cross the inactive cells until arriving at the water table. In the system there exist mainly two recharge areas. A primary meteoric recharge area that, in the last 10 years has been 11.7 mm/year (2.5 times higher than the rest of the desert area and is located in the Jbel Maiz and Jbel Grouz mountains) and a secondary recharge area with important irrigation returns (10% in the zones in which inundation is the main irrigation method and 5% in the areas where drop by drop is the main irrigation method), losses of the network of sewage, supply and drain system (foggaras).
The constant concentration has been implemented in order to simulate the regional chloride transport. It was assumed that layers 7 and 8 (formed by Triassic materials) present constant Cl-, Na+, K+, Ca2+ and Mg2+ concentrations that are coincident with chemical thermal sources. In order to reconstruct the salinization process that has taken place throughout the time because the irrigation return process, a program was constructed in order to reproduce the process of reconcentration of Cl-, Na+, K+, Ca2+ and Mg2+ over time. This program is based on the linear relationship between the cations and chlorides concentration. However, the existence of cationic exchange and sorption processes required the use of the evaporation straight line, in order to estimate the percentage of cationic sorption, and recalculation of the increase in concentration of the initial solution. The program calculates the ion concentration in solution for each stress period based on the initial irrigation water concentration and taking into consideration the accessible reserve of wells, the monthly pumping of the irrigated surface and the percentage of irrigation returns. In addition, the program also calculates the isotopic fractionation that takes place during the evaporation process.
On the other hand, in order to simulate the potential impact of a future municipal landfill in the Tisserfine zone on the aquifer formation, a chloride point source was implemented. The theoretical concentration of chlorides was 1100 mg/l. Other compounds have not been introduced because the evolution of the contaminant plume of chloride, as a conservative tracer, will allow knowing the maximum impact of the landfill. The recharge concentration implemented corresponds with the Oued Dfilia River waters because rain chemistry was unknown.
In the third phase 200 pumping wells were introduced, as well as the control level and concentration points. Prior to the pumping regime, the hydric requirements during the stress periods of the agricultural areas were hydric requirement unknowns. They were, therefore, estimated using the CropWat4 Windows Version 4.2 software. Thus, the water volume necessary to satisfy the agricultural demand was distributed between the wells of each agricultural area. The water volume necessary to satisfy the hydric requirements of the plants, by surface unit, has been reduced in order to consider the returns from agriculture and from the foggara drains. Finally, the pumping rate was calculated and compared with declared water extraction and with the number of running hours for each of the wells.
In the fourth phase zone budgets were established in order to evaluate the hydraulic balance of the system over all the areas where demand is concentrated.
Finally, in the fifth phase hydraulic and transport parameters were introduced in order to simulate the regional flow which is preferredly horizontal, with Kx=Ky=0.5Kz along the layers and vertical in the fracture zones with Kx=Ky=5Kz. This configuration allows the drainage of the layers through the faults.
Once constructed, the flow and transport mathematical model was executed, with the Preconditioned Conjugate-Gradient Package solver (PCG2), and later calibrated in steady and transient regimes.
Finally, various scenarios were created in order to study and evaluate the different future situations of the system. Between these scenarios, the pumping rate was increased in different areas in order to observe the results, such as in the Tisserfine and the Arja zones, which present a greater perspective for growth. Also, a scenario has been created that attempts to simulate the evolution of the chloride concentration as a result of the recycling of irrigation waters in the Figuig village and in its main agricultural extensions (Tisserfine and Arja). Other scenario simulates the impact of the Tisserfine landfill in the groundwater.
Results and discussion
The model of the Oasis of Figuig simulates better the regional flow than the local flow. For this reason it can considered as a regional model instead of a local model. This observation suggests that the model will work on a global scale of the system or on an agricultural area scale. It is very difficult to evaluate a local problem such as for example the interferences between wells.
The flow model has been calibrated using the different water table measurement data. At a global scale, the data of June 1996 (DRH, 1996) has given a fit with a Root Mean Squared (RMS) of 8.5%. Data from March 2001 on the other hand, presents a RMS of 9%, with the exception of three points, in which the difference between calculated and observed levels does not surpass 3 m.
The calibration of different zones and layers showed that the comparison between calculated and observed levels in the zone of Tisserfine for the 1996 data gave a RMS of approximately 10% with a difference of 2-4 m between levels, with the exception of some boreholes in fissurate and karstification limestone (layer 6) that displays greater errors. In this zone, the calculated levels are slightly higher to the field observations. This fact could indicate the existence of a pumping local drawdown that the model is not able to reproduce.
The Arja zone presents the worst adjustment with a RMS of 20% for the 1996 and 2001 data. Its characteristics and location close to the limits of the model, may contribute to increase the errors because edge effects. Near the flood plain of the Oued Zousfana River, numerous lateral changes of facies are observed that can condition and modify the hydraulic behaviour of the aquifer formation. There are two sectors with noticeably different calibration errors. In the northern sector, characterized to be topographically higher than the rest of the zone, positive errors are displayed whereas in the rest of the zones there are negative errors. The calibration in the Hammam Fougani and in the Hammam Tahatani zones as well as in the zone influenced by Figuig’s fault have a quite good fit (approximately 8% error and the calculated levels do not vary more than 2 m from the field mesurements). This good correspondence between calculated and observed levels in these areas and in layers 3, 6 and 8 are explained by the GHB, which has been implemented in order to simulate the drainage of Figuig’s fault.
In the Arja and Hammam zones the introduction of a directional fault that crosses the Figuig’s fault, better simulates the flow and favours the drainage of the system. This fault can be deduced from geology, gravimetry, thermometry and water table map (Puigserver, 2004).
In the Baghdad, Zenaga and Bercoukes zones, located towards the south of the Figuig’s fault, the calibration adjustments are quite good in relation to the available data. For 1996, 1999 and 2001 data, the RMS are of approximately 7%, 9% and 7.5% respectively. The levels in these areas are essentially controlled by two factors. First, the Oued Zousfana River in the zone of Baghdad, that constitutes a natural output flow of the system, conditions the morphology of the potentiometric curves and the flow lines that converge towards the river. The calibration errors in this sector give a very heterogenous distribution and depend on the relationship between layers 1 and 3. Secondly, the water levels in the Zenaga and Bercoukes sectors that adjust between 2 and 3 m, are controlled by the subvertical fault NW-SE. The water volume that drains towards the Algerian territory through these subvertical faults is controlled by the CHB in the limit of the model.
Finally, it is necessary to indicate the existence of control level points (established during 1996), that are coincident with the supply wells and exploit layer 6, that show a good adjustment with the calculated levels with the exception of the Teniet the Beida zone.
The sensitivity analysis of the model has shown little influence of the initial levels at the beginning of the simulation period. These solely affect the time required to reach convergence. The mathematical model is sensitive to the constant level in the first and second layers that permits simulation of the lateral output. On the other hand, the levels assigned to layers 3, 4, 5, 6 and 7 condition the equipotential geometry and, consequently, the calibration errors in the Arja, Hammam Tahatani and Fougani, Zenaga and Bercoukes zones. An increase in the levels of layer 8 contribute to an increase in the levels of layer 6, whereas the levels and the vertical conductances calculated by ModFlow for layer 8 are controlled by the hydraulic conductivity assigned to layer 7. The confinement degree of aquifer formations depends on hydraulic conductivity and when it increases the levels in layer 6 rise. In order to avoid overpressures in layer 6, a low hydraulic conductivity in layer 7 was chosen. The most sensitive layers to the hydraulic conductivities variations are the 4, 6 and 8. The listric fault controls in some cases the drainage of the system, while layers 6 and 4 (fissured or karstificated carbonated layers) are sensitive to the hydraulic conductivity assigned in order to change the flow velocity. The faults are sensitive to the hydraulic conductivity, especially in subverticals faults. The level assigned to layer 6 conditions the calculated in the above layers because it has a greater hydraulic conductivity than that of the rest of the carbonated layers and that is at the same time concordant with the conductance assigned to the geothermal sources. Layers 3 and 4 present the same behaviour as layer 6.
When pumping water increases, it is observed that the most sensitive zone is the Arja’s area, whereas the Figuig’s fault and the Hammam zones are not as sensitive because the GHB controls the calculated levels and conductances through each cell. Similarly, the Zenaga and Bercoukes zones are less sensitive because the water level is controlled by the drainage of subvertical NW-SE faults. This drainage depends on the CHB implemented to simulate the lateral flow to the Algerian territory and the gradient in the Figuig’s fault. For this reason the system is more sensitive to an increase of the pumping water in the Zenaga than in the Bercoukes zone. It is important to emphasize that the calculated levels can be fit well to the observed levels, but the allocation of high conductances generates important water volumes that do not allow simulating the water level oscillations in function of the water recharge changes and pumping water regime.
The model is also sensitive to the conductance variations along the bottom of the Oued Zousfana River that is hydraulically connected with layers 1 and 3. Along this hydraulic parameter, effluence of the river is also controlled.
The results of the model in the listric fault (layer 8) show the highest water levels, (figure 4) which oscillate between 965 (in the north-western sector) and 930 m (in the north-eastern sector), while the more elevated gradients are observed in the model limits and in the northern sector of the Figuig’s fault. The directions of the velocity vectors are SW-NE and they converge in the fault zones. The presence of the subvertical faults (NW-SE) that cross the central sector of the study zone, favours the ascending flow and divides the study area in two zones with different flow direction: the western sector with a SW-NE flow and the eastern sector with NW-SE flow.
The NE sector presents gradients that progressively diminish towards the Arja zone. In this and in the Figuig’s areas, the most complex potentiometric curves morphology is displayed. The factors that condition this morphology are the directional (SW-NE) and subvertical faults. The subvertical faults, from the north to south, cross the Arja zone, the Figuig’s fault and the agricultural Baghdad zone and behave as drainage lines. The potentiometric curves run between 825 m in the south of the fault to 870 m in the Arja zone. This is emphasized in the Figuig’s fault sector, where the high gradients are a result of the presence of piezometric domes (860-890 m), which are caused by ascent of the deep circulation waters through the fault. In the south-western sector (Zenaga and Bercoukes zones) the presence of the subvertical faults (NW-SE and W-E) also favours the drainage of the system and the inflexion of the potentiometric curves. Finally, the listric fault, which is vertical in the southern sectors, favours the vertical flow and the output of the system.
In general the flow model in layer 6 (Figure 4) is similar to that previously described, although it is observed that the gradient is lesser than that in layers 7 and 8 because it presents greater hydraulic conductivity and does not have a lateral input flow.
The flow model in layers 3 and 4, where pumping wells are concentrated, is similar to that in the layer 6. However, the piezometric level increasing in the limits of the model and in the Figuig’s fault influence zone (where the ascending vertical flows are important) makes difficult the detection of pumping cones. The flexion of some if the isopiezometric lines indicates the presence of pumping wells in Arja, Hammam Fougani and Tahatani and in the north of the Zenaga sectors. Often the piezometric levels in layer 3 are greater than the topographic level that favours an ascending vertical flow towards layers 1 and 2 through the bottom of the Oued Zousfana River beyond the Arja region.
In order to analyse the evolution in noninfluenced levels, the first few years were considered. At that time there were not many pumping wells. During this period the progressive decrease of the levels was caused by the recharge diminution. It is observed that the diminution of levels is not homogenous (Table 2). Thus in the Tisserfine and Arja sectors this decrease oscillates between 0.05 to 0.036 m/year respectively, whereas it is significantly smaller in the influence zone of the sources because of the piezometric dome that maintains constant the rate of flow from the sources.
On the other hand, water table oscillations and total pumping water in influenced regime (Table 2 show differences between the zones. Thus, in the Tisserfine sector, the pumping drawdown oscillate between 0.2 and 1 m while in the Arja zone it oscillates between 1.5-2 m, which is quite consistent with the field data. In the Figuig’s influence fault, it was detected that pumping cones are smaller and often are not greater than 0.5 m in the piezometric dome and in the fissured greater hydraulic conductivity zone of the fault. In the Bercoukes and Zenaga zones the pumpings were calculated, to be smaller than the Arja because they are under the subvertical fault influence.
The hydric resources evolution in the Figuig zone shows a progressive decrease in the inputs and storage, and an increase in the outputs, as well as the lateral inputs are more important than recharge. These observations show how anthropic pressure in a sector can affect the rest of the system. This implies that the management water resources measures must consider all of the zones that form the Figuig region.
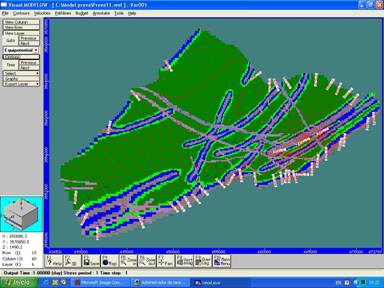
Fig 4: Piezometric map of layer 6.
Table 2: Piezometric levels and drawdown evolution calculated with the mathematical model.
|
Zone |
Layer |
Noninfluenced regime |
Influenced regime |
|
Water level decrease associated with recharge decreasing (m/year) |
Pumping drawdown oscillations (m) | ||
|
Tisserfine |
3 |
0.05 |
0.2-1 |
|
Arja |
3 |
0.036 |
1.5-2 |
|
Influence sources zone |
3 |
0.01 |
0.4-1 |
|
4 |
0.04 |
0.05-0.5 | |
|
6 |
0.04 |
not detected | |
|
Zenaga and Bercoukes |
3 |
0.01 |
0.15-0.8 |
The hydric balance, based on the main agricultural zones, showed that the pumping water was often greater than the recharge produced in the region. This means that most of these zones are overexploited. The more negative storage values are presented in the Arja, Tisserfine and Bagdad zones, However, in the area influenced by Figuig’s fault, and in the Hammams and Laabidate areas, the storage often is positive (specially in Laabidate) because these areas ascending waters of deep circulation permit the maintenance of a constant water rate in the geothermal sources.
Flow model in influenced regime shows a decrease of the levels and of the resources of the aquifer system as a result of the progressive diminution of the recharge and the progressive increase of the water pumped.
Simulation of the chloride concentration evolution, as a result of the irrigation returns, shows that the diffuse contamination has increased with time (Figure 5). This figure shows the chemically different waters in the Figuig’s area as well as the progressive increase in the salinization of the shallower aquifer formation. The Figure also shows that the diffuse contamination has not advanced significantly over time because the low velocity flow favours more the molecular diffusion than the advective transport.
On the other hand, the existence of vertical flow of deep circulation waters preserves the lower formations of the anthropic salinization.
All this is consistent with the observed electromagnetic data obtained in our geophysical field survey. Figure 6 shows the morphology of the diffuse contamination in depth, which is not greater than 40 m.
In contrast, the transport along faults is mainly due to advection. The scenario created in order to simulate the impact of Tisserfine’s landfill in groundwater shows that if it were located in the influence of the fault area, where advection transport predominates, the potential contamination plume can mobilize and affect supply wells.
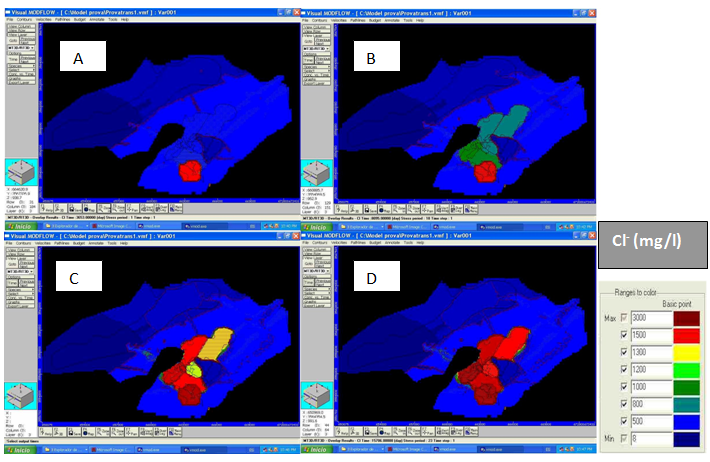
Fig 5: Chloride concentration evolution in the in layer 3 after: A) 3653 days, B) 8095 days, C) 13939 days and D) 15706 days.
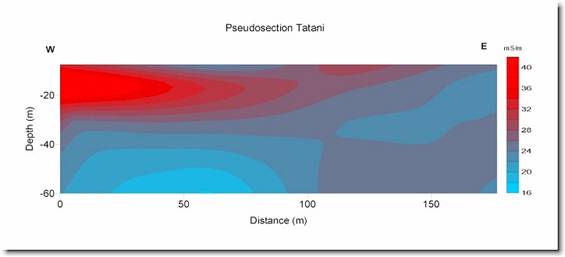
Fig 6: Pseudosection of the electrical conductivity variation in the land in the Hammam Tahatani zone. Left Cl- affected side corresponds with an irrigated plantation of date palms. Right side corresponds with an abandoned non-cultivated land.
Conclusions
The mathematical flow and transport modelling of the Figuig’s Oasis aquifer system has allowed improvements in the conceptual model from Puigserver (2001). Also has allowed to characterize the main hydraulic parameters and the flow through the fractures, as well as to visualize the hydraulic behaviour. In addition it has been possible to study the evolution of the salinization during the period 1960-2002 and to elaborate a proposal of hydric resources management.
The elaboration and execution of the different scenarios have shown that the mathematical model reproduces reasonable well the field observations. During the calibration process it was constated that in limited resources zones, such as the Oasis of Figuig, the lack of data determine the structure of the model and require the implementation of numerous boundary conditions in order to fit the model into a realistically fashion.
The calibration in stationary regime has allowed to observe that the calculated levels in Tisserfine are controlled by the GHB, whereas in the Arja zone the existence of numerous lateral facies changes increase the calibration errors. The calibration has also allowed detection of the existence of a subvertical fault that crosses the Figuig’s fault. This fault controls the levels in the Arja and Hammam zones and has shown the importance of the fracturation in the hydraulic behaviour of the system. The zones located towards the south of the Figuig’s fault (Zenaga, Bercoukes and Baghdad zones) show that the water levels are controlled by the natural output of the system towards the Oued Zousfana River and the NW-SE. subvertical fault. This subvertical fault acts as a drainage line and locally condition the distribution of water levels in the zone of Bercoukes. The calibration in transient state has shown that the piezometric oscillations take place as a result of the pumping water regime and the decrease of recharge. It depends on the conductances assigned to the layers in order to condition the lateral input and output flow.
The sensitivity analysis has shown that it exists a different degree of importance of the boundary conditions and that the initial water levels have a little influence. CHB is the boundary condition that dominantly controls the simulated flow, whereas the conductance assigned to GHB controls the water rate between cells. The transport model shows that the constant concentration controls the chemistry of the aquifer formation and permits simulation of the evolution of salinization. The model is more sensitive to hydraulic conductivity variations than the storage variations mainly because of the confined character of the aquifer formation and the low recharge rate. Also, it has been verified that the model as a whole is sensitive to the hydraulic conductivity variations into the faults, especially in subvertical faults.
Evaluation and validation results conclude that the subvertical faults favour the drainage of the system towards the Algerian sector and divides the area of study into two zones, each with differentiated directions of flow: in the western sector the main direction is SW-NE and in the eastern sector the main direction is NW-SE. In the Figuig’s fault sector a piezometric dome exist along both sides of the subvertical fault as a consequence of deep water ascent. While to the south of the village, the listric fault verticalization favours the ascending vertical flow with the exception of the sectors hydraulically connected with the Algerian territory.
The progressive decrease of the piezometric levels, due the diminution of the recharge of the system, is more significant in the Tisserfine and Arja sectors (0.05 and 0.036 m/year) than in the influence zone of the geothermal sources, because the piezometric dome existing in that zone. The more sensitive sectors to the progressive decrease of the resources are Tisserfine and Arja, whereas the zones that are influenced by the Figuig’s fault display smaller piezometric oscillations.
In the sectors of Zenaga and Bercoukes the decrease in calculated piezometric levels is smaller because they are influenced by subvertical faults. Water level oscillations in the influenced regime depend on the pumping water volume in each zone.
The hydric balance evolution in the agricultural areas shows that in these zones pumping water is greater than recharge, as well as inputs and outputs. The result is that there are many zones with negative storage variation, which means that output water is greater input water. Despite this, the water rates in geothermal sources have stayed constant with time. This indicates the great inertia of the system and the importance of its water reserves.
Possible increases of the pumping water volume in the Tisserfine zone may not affect the source water rate, but it will contribute to decreasing the water levels. In light of the model results the new supply wells should preferredly be drilled in the zone influenced by Figuig’s fault and in the Lias carbonated formation.
The transport model has shown that the diffuse contamination has not advanced significantly through the time, which is explained by the low flow velocity, with the exception of the fault areas, where advective transport predominates, in the hydrogeological formation.
Acknowledgements:
We would to thanks the Fundació Solidaritat of the Barcelona University, the Spanish Internacional Cooperation Agency, the Generalitat de Catalunya, the Ajuntament de Barcelona and the Dr Klaus Bitzer, professor of the University of Bayreuth (Germany) for their contribution and support to this research. We are also grateful for the support of the Municipality of Figuig and the Association des Coopératives Agricoles de Figuig (ACAF) and all of the Figuig’s population.
References
[1]
Bencherifa A. and Popp H.
(1990) (a): L’économie oasienne de Figuig entre la tradition et le changement. Actes du colloque maroco-allemand de
[2] Bencherifa A. and Popp H. (1990) (b): L’oasis de Figuig: persistance et changement, Passauer Mittelmeerstudien, Sonrreihe 2, Passavia Univ. Verlag, 110.
[3] Breil, P. (1977): Le Haut Atlas oriental. Ressources en eau du Maroc. Tome 3. Domaines atlasique et sud-atlasique, Notes et Mémoires du Service Géologique du Maroc. 231, Rabat. pp. 140-159.
[4] Carmona, J. Mª: (2001): Implementación de un Sistema de Gestión de los Recursos Hídricos del Oasis de Figuig (Marruecos Oriental), pp 1-27. Unpublished
[5] Direction Régional Hydraulique de Maroc (DRH) (1995): Ressources en eau de la palmerai de Figuig. Univ. de Oujda (M. Et-Touhami): DRH Rapport, pp. 51 pp. Unpublished
[6] Jungfer E. and Samimi C. (1989): Le danger de salinisation dans les oasis maghrebines: l’exemple de Figuig. Revue du Géographie du Maroc, 13. Nouvelle série nº 1 pp. 87-103
[7]
Jungfer and Eckhardt (1990): Les eaux de Figuig. Nouvelles recherches sur les
problémes de la genèse des eaux douces et des eaux salées au Maroc oriental. Actes du colloque
maroco-allemand de
[8] McDonald, M.G. and Harbaugh, A.W. (1988): MODFLOW Packages Reference Manual. Chapter A1. A modular three-dimensional finite-diference ground-water flow model. Book 6, USGS, Virginia, 5-36.
[9] Puigserver D. (2001): Caracterització hidroquímica de les aigües subterrànies de l’Oasi de Figuig (Alt Atlas-Marroc sudoriental. Tesis de Master de Geología Experimental. 109 p.
[10] Puigserver D. (2004): Model matemàtic de flux i transport del sistema aqüífer de l’Oasi de Figuig com a eina de gestió dels seus recursos hídrics (Alt Atlas-Marroc sudoriental). Trabajo de Investigación para la obtención del D.E.A. 168 p. Universitat de Barcelona.
[11] Puigserver D. and Carmona J.Mª (2005): Caracterización química e isotópica de los recursos hídricos del oasis de Figuig para la elaboración del modelo conceptual de flujo y transporte (Marruecos Sudoriental) In: Fernández, A. (Ed.) VIII Simposio de Hidrogeología, IGME, Zaragoza, 359-370.