


Achievements
ANALYSIS OF THE SPATIAL VARIABILITY AND STATIS- TICAL CHARACTERISTICS OF GROUNDWATER IN THE TAKLIMAK AN DESERT
1. Key Laboratory of Western China’s Environmental Systems, MOE, Lanzhou University, Lanzhou 730000,
2. Cold and Arid Regions Environmental and Engineering Research Institute, Chinese Academy of Sciences, Lanzhou, 730000, China; *Author for correspondence
Abstract: This paper analyzed the characteristics of chemical composition and spatial variability of groundwater in the lower reaches of Andier river in the south edge of Taklimakan desert and along the desert highway in Tarim basin by means of collecting water samples, investigating groundwater and analyzing of chemical composition of groundwater. The single gene of groundwater chemist component in desert with partial interfix analyze indicated that, in the north part of desert highway, partial correlation of groundwater mineralize degree is highly notability with Na+,Mg2+,Ca2+, and relatively notable with HCO3-, but there is no notability with other ions. In the south part of desert highway, partial correlation of groundwater mineralize degree is extraordinary notability with SO42-,HCO3-,Cl-, and quite notability with Na+,Ca2+,Mg2+, but there is no partial correlation with any else ions. In the lower reaches of Andier river, partial correlation of groundwater mineralize degree is extraordinary notability with HCO3-,SO42-,Cl-,Na+, and quite notability with Mg2+,Ca2+, but there is no partial correlation with any other ions. Calculating the variability coefficients of main ions in groundwater by SPSS statistical software. The results indicate that the variability coefficients of groundwater table depth and electrical conductivity in the south part of desert highway are obviously smaller than that in the lower reaches of Andier river and the north part of desert highway. It belongs to low degree of variation. The variability coefficients of groundwater table depth are bigger in the lower reaches of Andier river, and belong to high degree of variation. The observed values of groundwater chemical compositions are the smallest in the north of desert highway and the variability coefficients are also the smallest. Those in the south part of desert highway are the second smallest and the variability coefficients are in middle. But they are generally bigger in the lower reaches of Andier river and the variability coefficients too. Electric conductivity puts up the opposite characteristics, when the average value is small, the variability coefficient is big.
Keywords: Taklimakan desert; desert highway; chemical composition of groundwater; spatial variability
Introduction
The spatial variability of groundwater during its bedding, storage and movement progress is one of the most important characteristics of groundwater (Zhang et al.,1995). The token variability of groundwater potential, chemistry and temperature field can be
obtained in different observation point, and then get the hydrological geology data spatial series, and also gained these spatial data and landform, degree of slope, coverage of plants, river distribution, rock character and geological structure synthesize information, and analyze spatial variability. All of these are the key of disclosure groundwater spatial distribution characteristics and law of space variety (Zhang et al.,1995).
Since 1970s’, geostatistics was used for water resource researching (Rainer Loof et al.,1994). In groundwater study, the hydrological geology parameter of permeability coefficient, storage coefficient could be considered as random function that change with spatial location, and with geology structure characteristics and random function characteristics. Delhomme first used geology statistics for hydrological geology area, after this, some researchers used simple-kriging or ordinary kriging method for conductivity coefficient spatial variability research (Hou,1996; Wang,1996; Aboufirassi M. et al.,1984; Yates S. R. et al., 1986; Heeksema R. J.,1989). In recently, many researchers of
et al., 1998; Hu et al., 2000).
1 General Situation of Study Area
Taklimakan desert lies in the Tarim basin which is the biggest inland basin between tianshan and kunlun mountain, aerking mountain, and present ellipse type, east-west line is about 1100km, south-north is 375km, total area is 33.76×10⁴km2, and it occupied 64% of Tarim basin, 47.2%of China desert, that is the biggest desert in China, and it is also the second biggest desert which is smaller than Rubalkhal desert in Arab peninsula (Xia,1994;Tursun·Kasim et al., 2000).
The first high-type desert highway for exploration and development oil in 1990s’, started in Lunnan from north, south to west of Mingfeng county 17km, and collected with 315 national highway, and the total length is 518km. It crosses Taklimakan desert, and lies in the middle deviation to east part in the Tarim basin (Cheng et al., 1997).
2 Characteristics of Groundwater Distribution in Desert
Around Tarim basin, the mountain creek was collected by glacier melting and precipitation, and through runoff and groundwater deliver to piedmont sloping flat, then came into desert, and composed typical inland entad water system of Tarim basin (CAS.,1993).
Groundwater in superficial layer appears mainly in Quaternary loose stuff pore underground water, has unit dive table, and depth is below 100m. Water bearing layer mostly belongs to sediment layer, water deposit and wind-drift interlace layer, or wind-drift unity layer without consolidation.
After these rivers including Yeerqiang river, Hetian river, Keliya river, Niya river and Cheercheng river emanate from north of Kunlun mountain run out of gap, vertical percolation obvious along the road, and transformed supply groundwater in desert. Modern river replenishes groundwater in desert just locally river bilateral and terminal contiguous desert edge, groundwater affection in hinterland needs longer periods. In south desert, river can’t come to hinterland in normal years if flow is short, and there is no straight leakage replenishment for groundwater. Therefore, ground flow side replenish in the southern plain is the mainly recharge source of desert groundwater. Distributing form of groundwater contour in the south of desert is similar with topographic contour, and submit uniformity distribute with regularity, the density turns scarce from south to north; and hydraulic gradient is similar with land degree of slope, present south to north trend, as distance extends, hydraulic gradient becomes smaller. South hydraulic gradient is about 1‰~1.5‰(Du, et al., 2005).
Along south of desert highroad L518km to L498km tanan path team, area groundwater is supplied by Niya river influent and run out of stream, groundwater depth is about 2.0m. The tanan path team L498km to middle L293km stand in fluid desert, superficial layer groundwater is widespread distributed, all is desert water-bearing zone, except old stream water-bearing zone at the collection of Yatonggusi river and desert highroad; under flow is slowness, and replenishment is delicacy (Du, et al., 2005; Li, et al., l995). Superficial layer groundwater along north of desert highroad mostly comes from Tarim river and seasonal flood supply in middle, and they are mainly supply fountain of superficial layer groundwater in desert. Along desert highroad, most sector underwater hydraulic gradient is about 1.0‰, L145km to L153km potential line is closer, hydraulic gradient is about 2.0‰, forward to northward, hydraulic gradient declined to0.5‰. Hence, pathway of potential is approximately from south to north, after Tarim river alluvial flat, it turns to east.
3 Groundwater Spacial Information Status
Correlation analysis is one of the common statistical methods that describes variance intimate level, and covariance and related coefficients are used to judge relation and direction at random two variables (Zhou, 2002). When analyze relation among multi variables, controlling influence of other variables, and analysis correlation between two variables separately, that is the measuring static magnitude of partial correlation degree.
Analysis the causality of desert groundwater space information by correlation analysis method, use single gene and partial correlation analyze confirm hydrochemical information which is determinant influence factor of mineralize.
Tab.1 Ion Pearson correlation matrices in groundwater in the north part of desert highway
|
Na+ |
K+ |
Ca2+ |
Mg2+ |
Cl- |
SO42- |
HCO3- |
F- | |
|
N |
||||||||
|
93 |
93 |
93 |
93 |
93 |
93 |
93 |
92 |
|
|
Na+ |
1.000 |
0.611** |
0.862** |
0.950** |
0.992** |
0.926** |
0.066 |
-0.237* |
|
P |
||||||||
|
0.000 |
0.000 |
0.000 |
0.000 |
0.000 |
0.529 |
0.023 |
||
|
K+ |
||||||||
|
1.000 |
0.369** |
0.525** |
0.642** |
0.424** |
0.180 |
-0.064 |
||
|
P |
||||||||
|
0.000 |
0.000 |
0.000 |
0.000 |
0.085 |
0.543 |
|||
|
Ca2+ |
||||||||
|
1.000 |
0.891** |
0.869** |
0.915** |
-0.144 |
-0.363** |
|||
|
P |
||||||||
|
0.000 |
0.000 |
0.000 |
0.169 |
0.000 |
||||
|
Mg2+ |
||||||||
|
1.000 |
0.956** |
0.945** |
0.078 |
-0.295** |
||||
|
P |
||||||||
|
0.000 |
0.000 |
0.460 |
0.004 |
|||||
|
Cl- |
||||||||
|
1.000 |
0.905** |
0.023 |
-0.256* |
|||||
|
P |
||||||||
|
0.000 |
0.826 |
0.014 |
||||||
|
SO42- |
||||||||
|
1.000 |
0.050 |
-0.298** |
||||||
|
P |
||||||||
|
0.635 |
0.004 |
|||||||
|
HCO3- |
||||||||
|
1.000 |
0.412** |
|||||||
|
P |
||||||||
|
0.000 |
||||||||
|
F- |
||||||||
|
1.000 |
Note: *correlation conspicuous level reach 0.05(2-tailed);** correlation conspicuous level reach0.01(2-tailed)
Form tab.1 we can see that in groundwater in north desert highroad, Na+,Ca2+,Mg2+ are obvious correlation with Cl-,SO42-, HCO3-,F- are not obvious coherent with other ions, but they take on some correlations mutual.
Tab.2 Ion Pearson correlation matrices in groundwater in the south part of desert highway
|
Water table depth |
Na+ |
K+ |
Ca2+ |
Mg2+ |
Cl- |
SO42- |
HCO3- |
F- | |
|
N |
66 |
66 |
66 |
66 |
66 |
66 |
66 |
66 |
66 |
|
Water table depth |
1.000 |
-0.176 |
-0.064 |
-0.098 |
-0.115 |
-0.143 |
-0.170 |
-0.266* |
-0.093 |
|
P |
0.158 |
0.609 |
0.435 |
0.359 |
0.252 |
0.173 |
0.031 |
0.455 | |
|
Na+ |
1.000 |
0.400** |
0.747** |
0.857** |
0.978** |
0.924** |
0.698** |
0.523** | |
|
P |
0.001 |
0.000 |
0.000 |
0.000 |
0.000 |
0.000 |
0.000 | ||
|
K+ |
1.000 |
0.303* |
0.374** |
0.384** |
0.423** |
0.266* |
0.250* | ||
|
P |
0.013 |
0.002 |
0.001 |
0.000 |
0.031 |
0.043 | |||
|
Ca2+ |
1.000 |
0.695** |
0.767** |
0.788** |
0.457** |
0.266* | |||
|
P |
0.000 |
0.000 |
0.000 |
0.000 |
0.031 | ||||
|
Mg2+ |
1.000 |
0.925** |
0.924** |
0.660** |
0.549** | ||||
|
P |
0.000 |
0.000 |
0.000 |
0.000 | |||||
|
Cl- |
1.000 |
0.92** |
0.651** |
0.500** | |||||
|
P |
0.000 |
0.000 |
0.000 | ||||||
|
SO42- |
1.000 |
0.730** |
0.530** | ||||||
|
P |
0.000 |
0.000 | |||||||
|
HCO3- |
1.000 |
0.627** | |||||||
|
P |
0.000 | ||||||||
|
F- |
1.000 | ||||||||
|
P |
0.00 |
Note: *correlation conspicuous level reach 0.05(2-tailed);** correlation conspicuous level reach0.01(2-tailed)
Tab.3 Ion Pearson correlation matrices in groundwater in the lower reaches of Andier river
|
Water table depth |
Na+ |
K+ |
Ca2+ |
Mg2+ |
Cl- |
SO42- |
HCO3- |
F- | |
|
N |
|||||||||
|
43 |
43 |
43 |
43 |
43 |
43 |
43 |
43 |
43 |
|
|
Water table depth |
1.000 |
-0.304* |
-0.268 |
-0.325* |
-0.312* |
-0.324* |
-0.306* |
-0.130 |
-0.225 |
|
P |
|||||||||
|
0.047 |
0.083 |
0.033 |
0.042 |
0.034 |
0.046 |
0.405 |
0.147 |
||
|
Na+ |
|||||||||
|
1.000 |
0.975** |
0.340* |
0.818** |
0.962** |
0.956** |
0.734** |
0.370* |
||
|
P |
|||||||||
|
0.000 |
0.026 |
0.000 |
0.000 |
0.000 |
0.000 |
0.014 |
|||
|
K+ |
|||||||||
|
1.000 |
0.284 |
0.719** |
0.904** |
0.954** |
0.694** |
0.358* |
|||
|
P |
|||||||||
|
0.065 |
0.000 |
0.000 |
0.000 |
0.000 |
0.019 |
||||
|
Ca2+ |
|||||||||
|
1.000 |
0.425** |
0.371* |
0.381* |
0.069 |
0.111 |
||||
|
P |
|||||||||
|
0.004 |
0.014 |
0.012 |
0.659 |
0.480 |
|||||
|
Mg2+ |
|||||||||
|
1.000 |
0.921** |
0.701** |
.632** |
0.299 |
|||||
|
P |
|||||||||
|
0.000 |
0.000 |
0.000 |
0.051 |
||||||
|
Cl- |
|||||||||
|
1.000 |
0.854** |
0.749** |
0.359* |
||||||
|
P |
|||||||||
|
0.000 |
0.000 |
0.018 |
|||||||
|
SO42- |
|||||||||
|
1.000 |
0.590** |
0.349* |
|||||||
|
P |
|||||||||
|
0.000 |
0.022 |
||||||||
|
HCO3- |
|||||||||
|
1.000 |
0.582** |
||||||||
|
P |
|||||||||
|
0.000 |
|||||||||
|
F- |
|||||||||
|
1.000 |
Note: *correlation conspicuous level reach 0.05(2-tailed);** correlation conspicuous level reach0.01(2-tailed)
In the south part of desert highway, groundwater table depths submit no significant counts to each ion, there is quite obvious correlation between Na+,Mg2+and Cl-,SO42-, and Cl-,SO42- have notability correlation. Other ions have no significant counts (tab.2).
In the lower reaches of Andier river, groundwater table depths submit negative correlation with Na+,Ca2+,Mg2+,Cl-,SO42-, and correlation among K+,HCO3-,F- are bad. Na+has relatively correlation with K+,Cl-,SO42-, and correlation between K+and Cl-,SO42- is obvious. Mg2+and Cl- are also obvious. Cl-and SO42- possess relativity (tab.3).
Upper correlation analysis is based on calculation of related coefficients between two variables. If some relations existence between more than two variables, the two variables are still influences by the third or other more variables. Then the correlation coefficients could not reflect linear relation two variables, and need partial correlation analysis.
Tab.4 Partial correlation coefficients between TDS and water quality information
in the north part of desert highway
|
Variable |
Na+ |
K+ |
Ca2+ |
Mg2+ |
Cl- |
SO42- |
HCO3- |
F- |
|
TDS |
0.9072 |
0.0075 |
0.7402 |
0.8493 |
0.0050 |
0.2552 |
0.3064 |
0.1234 |
|
Sample number |
83 |
83 |
83 |
83 |
83 |
83 |
83 |
83 |
|
P |
0.00 |
0.95 |
0.00 |
0.00 |
0.96 |
0.02 |
0.00 |
0.26 |
(Coefficient / (D.F.) / 2-tailed Significance)
Tab.5 Partial correlation coefficients between TDS and water quality information
in the south part of desert highway
|
Variable |
Ground water table depth |
Na+ |
K+ |
Ca2+ |
Mg2+ |
Cl- |
SO42- |
HCO3- |
F- |
|
TDS |
0.2217 |
0.7873 |
0.2009 |
0.6322 |
0.3981 |
0.9171 |
0.9686 |
0.9179 |
0.0210 |
|
Sample number |
56 |
56 |
56 |
56 |
56 |
56 |
56 |
56 |
56 |
|
P |
0.09 |
0.00 |
0.13 |
0.00 |
0.00 |
0.00 |
0.00 |
0.00 |
0.88 |
(Coefficient / (D.F.) / 2-tailed Significance)
Tab.6 Partial correlation coefficients between TDS and water quality information
in the lower reaches of Andier river
|
Variable |
Ground water table depth |
Na+ |
K+ |
Ca2+ |
Mg2+ |
Cl- |
SO42- |
HCO3- |
F- |
|
TDS |
0.0077 |
0.9598 |
0.4083 |
0.7771 |
0.8508 |
0.9859 |
0.9862 |
0.9874 |
-0.1035 |
|
Sample number |
33 |
33 |
33 |
33 |
33 |
33 |
33 |
33 |
33 |
|
P |
0.965 |
0.000 |
0.015 |
0.000 |
0.000 |
0.000 |
0.000 |
0.000 |
0.554 |
(Coefficient / (D.F.) / 2-tailed Significance)
From tab.4, tab.5 and tab.6, partial correlation of groundwater mineralize degree in north desert highroad, is very obvious with Na+,Mg2+,Ca2+, quite obvious with HCO3-, and not obvious with other ions. In south, partial correlation of groundwater mineralize degree is very obvious with SO42-,HCO3-,Cl-, quite obvious with Na+,Ca2+,Mg2+, and not obvious with other ions. At lower Andier river, partial correlation of groundwater mineralize degree is very obvious with HCO3-,SO42-,Cl-,Na+, quite obvious with Mg2+,Ca2+, and not obvious with other ions.
4 Analysis of Groundwater Space Information Variability
4.1 Statistic characteristics of groundwater information
Adopting parameters with important static characteristics in theory analysis centrality or discreteness of test data or sample data is the main method that can achieve data quantitative analysis. Statistic numbers in common use including: centerline-average, median, mode, range, standard deviation, coefficient of kurtosis and asymmetry coefficient, and coefficient of variability (Wang,1999; Feng,2000).
Groundwater table depth and hydrochemical data at lower Andier river and along desert highroad was collected by manual dig or well investigation (fig.1, fig.2). And also calculated the statistic eigenvalues (tab.7).
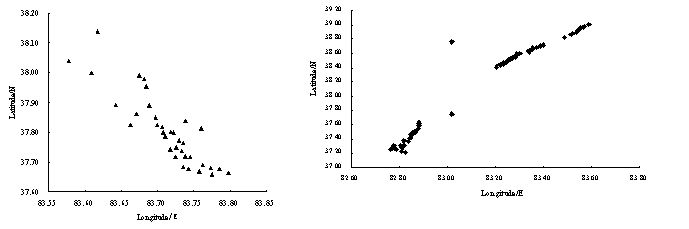
Fig.1 Main sampling points in the lower reaches Fig.2 Main sampling points in the south
of Andier river part of desert highway
4.2 Characteristics of groundwater spacial information variability
Form tab.7, we can see that average groundwater table depth is 2.856m in the lower reaches of Andier river, along the south part of desert highway groundwater table depth becomes shallow, average depth is 1.433m, and the variability coefficients of groundwater table depth and electric conductivity in the south part of desert highway are obvious smaller than that in the lower reaches of Andier river and in the north part of desert highway, that belongs to low degree of variation; variability coefficients of groundwater table depth in the lower reaches of Andier river belongs to high degree of variation. The observed average values of groundwater chemical compositions are the smallest in the north of desert highway and the variability coefficients are also the smallest. Those in the south part of desert highway are the second smallest and the variability coefficients are in middle. But they are generally bigger in the lower reaches of Andier river and the variability coefficients too. Electric conductivity represents the opposite characteristics, when the average value is small, the variability coefficient is big.
Frequency distribution maps clearly reflected ion content concentricity in groundwater and total variability instance. Each ion exist difference, frequency distribution submit symmetry or inadequacy symmetry single distribution. Fig.3 indicates that the frequency distribution of groundwater table depth in the lower reaches of Andier river is close to Ca2+ content; frequency distribution of Na+,K+,Cl-,SO42- are similar, and frequency distribution of Mg2+ is similar to total rigidity; ion content deviate left, correspond variability is large. Electric conductivity possesses the opposite frequency distribution with groundwater table depth and Ca2+ content. correspond variability is small.
Tab.7 Statistic characteristics of groundwater table depth and hydrochemical values in desert (a)(mg/L)
|
Research area |
Observation items |
Samples |
Average |
Median |
Mode |
Standard deviation |
Asymmetry |
Kurtosis |
Range |
Maximum |
Minimum |
Variability coefficient(%) |
|
A |
93 |
1342.903 |
1168.400 |
933.80 |
642.740 |
3.557 |
14.898 |
4282.600 |
5071.500 |
788.900 |
47.862 | |
|
B |
Na+ |
66 |
2079.291 |
1561.00 |
1450.000 |
2017.592 |
2.570 |
6.625 |
9991.000 |
10100.000 |
109.000 |
97.033 |
|
C |
43 |
3123.540 |
1159.900 |
210.000 |
5662.781 |
4.140 |
20.678 |
33540.000 |
33750.000 |
210.000 |
181.294 | |
|
A |
93 |
54.223 |
50.700 |
46.80 |
12.897 |
2.835 |
14.447 |
101.400 |
132.600 |
31.200 |
23.786 | |
|
B |
K+ |
66 |
157.440 |
130.000 |
130.000 |
191.576 |
4.936 |
30.186 |
1415.600 |
1425.00 |
9.40 |
121.683 |
|
C |
43 |
127.154 |
64.900 |
43.000 |
234.039 |
5.005 |
28.528 |
1485.500 |
1490.100 |
4.600 |
184.060 | |
|
A |
93 |
125.204 |
98.00 |
80.00 |
85.415 |
3.081 |
11.070 |
510.000 |
556.000 |
46.000 |
68.220 | |
|
B |
Ca2+ |
66 |
251.486 |
213.750 |
84.400 |
176.720 |
1.981 |
4.840 |
968.100 |
1000.000 |
31.900 |
70.270 |
|
C |
43 |
100.307 |
89.200 |
18.800 |
76.130 |
1.379 |
1.419 |
291.900 |
310.700 |
18.800 |
75.897 | |
|
A |
93 |
162.465 |
129.600 |
145.200 |
108.646 |
3.056 |
11.353 |
675.600 |
751.200 |
75.600 |
66.874 | |
|
B |
Mg2+ |
66 |
441.506 |
265.900 |
186.500 |
609.281 |
3.186 |
10.292 |
3276.900 |
3292.300 |
15.400 |
138.000 |
|
C |
43 |
336.128 |
147.500 |
18.400 |
432.770 |
2.243 |
4.505 |
1752.500 |
1770.900 |
18.400 |
128.752 | |
|
A |
93 |
1883.943 |
1615.250 |
1420.000 |
994.816 |
3.732 |
17.199 |
6915.40 |
8005.250 |
1089.850 |
52.805 | |
|
B |
Cl- |
66 |
3153.233 |
2229.250 |
1745.500 |
3381.509 |
2.654 |
6.699 |
15756.600 |
15873.800 |
117.200 |
107.239 |
|
C |
43 |
3859.749 |
1230.400 |
213.500 |
6276.360 |
2.985 |
10.020 |
31701.500 |
31915.000 |
213.500 |
162.611 | |
|
A |
93 |
1140.439 |
921.600 |
873.600 |
652.062 |
3.242 |
11.461 |
3552.000 |
4190.400 |
638.400 |
57.176 | |
|
B |
SO42- |
66 |
2337.876 |
1682.750 |
1057.100 |
2295.239 |
2.499 |
5.851 |
11058.900 |
11279.400 |
220.500 |
98.176 |
|
C |
43 |
2297.219 |
868.100 |
165.200 |
4507.945 |
4.561 |
24.104 |
27358.700 |
27523.900 |
165.200 |
196.235 | |
|
A |
93 |
177.622 |
164.700 |
183.000 |
70.394 |
0.881 |
1.445 |
408.70 |
433.100 |
24.400 |
39.631 | |
|
B |
HCO3- |
66 |
239.726 |
127.850 |
17.900 |
334.731 |
2.372 |
5.546 |
1624.600 |
1637.800 |
13.200 |
139.631 |
|
C |
43 |
919.221 |
555.000 |
267.900 |
937.283 |
2.202 |
4.526 |
4006.900 |
4274.800 |
267.900 |
101.965 |
Tab.7 Statistic characteristics of groundwater table depth and hydrochemical values in desert (b)(mg/L)
|
Research area |
Observation items |
Samples |
Average |
Median |
Mode |
Standard deviation |
Asymmetry |
Kurtosis |
Range |
Maximum |
Minimum |
Variability coefficient(%) |
|
A |
93 |
3.462 |
3.420 |
3.600 |
1.071 |
0.754 |
0.625 |
5.220 |
6.600 |
1.380 |
30.926 | |
|
B |
F- |
66 |
3.024 |
2.505 |
2.160 |
2.245 |
2.643 |
8.895 |
12.750 |
13.310 |
0.560 |
74.235 |
|
C |
43 |
5.391 |
4.000 |
4.180 |
4.164 |
1.243 |
0.696 |
16.470 |
17.410 |
0.940 |
77.241 | |
|
B |
Ground Water table depth(m) |
66 |
1.433 |
1.470 |
0.200 |
0.821 |
0.529 |
0.472 |
3.810 |
3.910 |
0.100 |
57.242 |
|
C |
43 |
2.856 |
2.000 |
2.000 |
2.493 |
1.134 |
0.894 |
10.450 |
10.550 |
0.100 |
87.309 | |
|
A |
93 |
4.879 |
4.100 |
4.000 |
2.438 |
3.493 |
14.278 |
15.800 |
18.800 |
3.000 |
49.983 | |
|
B |
TDS(g/L) |
66 |
8.646 |
6.325 |
0.740 |
8.563 |
2.486 |
5.646 |
40.327 |
41.068 |
0.740 |
99.037 |
|
C |
43 |
10.773 |
3.948 |
0.985 |
17.358 |
3.745 |
17.178 |
99.707 |
100.692 |
0.985 |
161.126 | |
|
A |
93 |
7.324 |
6.300 |
6.100 |
3.062 |
3.193 |
11.831 |
19.100 |
23.900 |
4.800 |
41.811 | |
|
B |
Electric conductivity |
66 |
21.315 |
21.900 |
23.000 |
3.368 |
-1.556 |
3.181 |
17.300 |
26.100 |
8.800 |
15.802 |
|
C |
43 |
18.045 |
18.550 |
14.600 |
5.434 |
-0.401 |
-0.926 |
19.300 |
26.000 |
6.700 |
30.111 |
Note: A, north part of desert highway; B, south part of desert highway; C, the lower reaches of Andier river.
Fig.3 Frequency distribution of main ions in groundwater in the lower reaches of Andier river
Groundwater table depth in the south part of desert highway possesses the opposite frequency distribution with electric conductivity, and symmetry is preferably, correspond variability is small. Na+、Mg2+、Cl-、SO42-、HCO3-、mineralize degree and total rigidity have similar frequency distribution (fig.4), ion deflection present left apex, correspond variation degree are large, that is the same rule with variability coefficient.
Fig.4 Frequency distribution of main ions in groundwater in the south part of desert highway

Groundwater table depth in the north part of desert highway possesses the same frequency distribution with Na+,Ca2+,Mg2+,Cl-,SO42-,mineralize degree,electric conductivity and total rigidity (fig.5), ion deflection present left apex, correspond variation degree are large. K+,HCO3-,F- content assume symmetry distribution, variation degree are lower.
Fig.5 Frequency distribution of main ions in groundwater in the north part of desert highway
5 Conclusions and Discussion
Based on the analysis of groundwater distribution rules, recharge mechanism and chemical components distribution characteristics of Niya river, Andier river and Yatonggusi river basin, and along desert highroad in the south of Taklimakan desert, and calculated the static value, primary analysis the groundwater space variability, all of this is the elements of space variability study.
Groundwater table depth, ion content that is provided with spacial distribution and randomicity characteristics variable belong to regional variable. While proving ion content distribution type whether obey normality or lognormal distribution, using Kriging interpolation method found variability function which is used for space data analyze and it is important ration model that analysis groundwater space variability. Basis the variability function model, using Kriging interpolation method protracts groundwater table depth and ion content distribution isoline maps can vertically master special variability characteristics of groundwater information.
Acknowledgements
This study was funded by the Tarim Basin Petroleum Engineering Project of PetroChina Company Limited during the Period of Ninth Five-year Named the Exploitation and Assessment of Usable Water Resources for the Desert oil Fields and the National Key Development and Programming Project for Basic Research of China (No. G2000048701).
Reference
[1] Zhang Zheng,Liu Shuchun,Ju Shuohua.GIS and variance analysis of the hydrogeological spatial
[2] distributed variables[J]. Site Investigation Science and Technology,1995,(3):30~34,29(In
Chinese).
[3] Rainer Loof,Peder Hjorth,Om Bahadur Raut. Rainfall network design using the Kriging technique: a case study of
[4] Hou Jingru. Review and prospect of geostatistics (spatial-informationstatics) development in
[5] Wang Renduo. Development trends of geostatistics[J]. Geological Science and Technology Information,1996,15(2):99-102 (In Chinese).
[6] Aboufirassi M.,Marino M. A.. Co-kriging of aquifer transmitivity from field measurements of transmitiviry and specific capacity[J]. Math Geol.,1984,16(1):19-36.
[7] Yates S. R.,Warrick A. W. and Myers D. E.. Disjunctive Kriging,l. Overview of estimation and conditional probability[J]. Water Resources Research,1986,22(5):615~621.
[8] Heeksema R. J.. Cokring model for estimation of water-table elevation[J]. Water Resources Res.,1989,25(3):429~435
[9] Liu Tingxi,Zhu Zhongyuan,Wang Qingyu. Application of extensive kriging method in the study of spacial variability of groundwater evaporation depth (D0) and its prediction[J]. Irrigation and Drainage,1994,13(3):31~35 (In Chinese).
[10] Chao Lunbagen,He Tai,Liu Tingxi. A study of spatial variability on aquifer hydraulic
conductivity[J]. Acta Geologica Sinica,1994,68(4):358~367(In Chinese).
[11] Chen Jiajun,Wang Hongqi,Zhang Zheng,et al. Geostatistical approach to groundwater level
estimation[J].Hydrogeology and Engineering Geology,1998,(6):7~10,26(In Chinese).
[12] Hu Kelin,Li Baoguo,Chen Deli. Spatial varibility of the regional shallow groundwater depth
and water quality. Advances in Water Science,2000,11(4):408~414 (In Chinese).
[13] Xia Yang. Chemical composition characteristics of dominant plant species in the taklimakan desert[J]. Journal of Desert Research,1994,14(2):30~36 (In Chinese).
[14] Tursun·Kasim,Kasim·Apiz,Hamit·Yimit. Human activities’ influence on the evolution of Tarim Basin’s environment since Historical period[J].Journal of Xingjiang University (Natural Science Editron),2000,17(1):81~86 (In Chinese).
[15] Cheng Guangting,Feng Qi,et al.. Formation and evolution of sand-wind environments along the
[16] desert highway in Tarim Basin[M].Beijing:Chinese Environmental Sciences Press,1997 (In
Chinese).
[17] Comprehensive investigation team about Taklimakan desert of Chinese
[18] Zhu Zhenda,Cheng Zhiping,Wu Zheng,et al.. Study of sand-wind physiognomy in Taklimakan desert[M]. Beijing:Science Press,1981 (In Chinese).
[19] Li Wenpeng,Hao Aibing,Liu Zhenying,et al.. Study of the perspective regions of exploiting groundwater in Tarim basin[M]. Beijing:Geology Press,2000 (In Chinese).
[20] Wang Zhenqing. Sand prevention and controlling of highway in
[21] Zhang Jianrong. Research in the searching for underground fresh water masses in electric sounding in the base Talimu Xin Jiang[J].Hydrogeology and Engineering Geology,1998,(6):54-58(In Chinese).
[22] Du Hulin,Ma Zhenwu,Xiong Jianguo,et al.. Water resources study and its utilization and
assessment along the Taklimakan desert and in desert oil fields in Tarim basin[M]. Beijing:
Ocean Press,2005(In Chinese).
[23] Li Wenpeng,Zhou Hongchun,ZhouYangxiao,et al..Groundwater movement systems in the typical arid zones in the northwest of China[M].Beijing:Earthquake Press,l995(In Chinese).
[24] Zhou Songbin. Based-GIS distribution patterns of Temperature and precipitation in the middle of
[22]
[23] Wang Zhengquan. Geostatistics and its application in the ecology[M]. Beijing:Science Press,1999,1-149 (In Chinese).
[24] Feng Xuezhi,Bo Yanchen,Shi Zhengtao et al.Snow depth in north Xinjiang region estimated by Kriging interpolation[J]. Journal of Glaciolgy and Geocryology,2000,22(4):358-361(In Chinese).