


Achievements
AN OPTIMAL CONTROL FOR INCREASING RATES OF INDUSTRY AND POPULATION UNDER LIMITED WATER RESOURCES*
(1. Institute of Applied Mathematics, Shandong Univ of Tech, Zibo, Shandong 255049, China; 2. Zibo Water Resources Management Office, Zibo, Shandong, 255032, China; 3. Institute of Environment Sci and Tech, Shandong Univ of Tech, Zibo, Shandong 255049, China; 4. School of Material Sci and Eng, Shandong Univ of Tech, Zibo, Shandong 255049, China; 5. Inspecting Station of Geology and Environment in Zibo, Shandong, 255091, China)
Abstract: Under constraints of limited water resources, and for the goal of sustainable development of society and economy, an optimal model for relationship of water resources with development of population and industry is formulated using domain analysis methods. In practice, we take social development plan of Zibo as a case study. The computation results show that this simple model can reflect a balance relation of the primary indicators in the society development, and can predict some global characteristics of water resources in Zibo with the society economy development in the future years.
Key words: Water problem and water resources, sustainable development, increasing rates of population and industry, optimal control
CLS Classification:N94
1 Introduction
Sustainable development has been widely studied from the end of 20th century. A lot of system models and assessment indicators have been established and researched in UN and many countries, even for smaller regions (see [1-4]). In actual department fields, such as agricultural sustainable development, industrial sustainable development, financial sustainable development etc., a series of special indicators and evaluating models came forth one after another. Although there have some different explanations to sustainable development, its essentiality is a coordination development between the nature and the society, which compose a moving, opening and complex system. Then, by system analysis method, predictable models may be established on more scientific meanings. These models can be used to supply scientific proofs and suggestions for the social development.
On the other hand, water resource has become a vital problem of resources and environment all over the world in the 21st century. Since the un-substitutable characteristics of water resource, it plays an important role in the development of society and economy. The sustainable development of a country to some extent relies on continuous utilization and development of water resources. Water problem becomes more serious in China (see [5]). It is a vital problem that how to realize a sustainable development on the base of lower level of water assumption, especially in China in the 21st century.
So, it has important realistic meanings to research harmonious relations between water resources and social economic sustainable development under the constraint of limited water resources. This paper is concerned with a controllable multi-objective system relating limited water resources with the increase of population and industrial economy with aids of system analysis and optimal method. Taking the social economic system of Zibo city as example, an optimal predicting model is established which reflecting an increasing relationship of population with industrial economy according to statistical data in 1997 and developing plan of the society and economy. By the model and computation with MATLAB software, optimal increasing rates of sustainable development for population and industrial economy of Zibo city in 2005 and 2010 are obtained.
2 Construction of Model
Without loss of generality, we take the north industry city--Zibo as example to construct the model. By the theory of sustainable development, population, society, economy and environment should be consistent and reach a well-cycled developing mode. Suppose that water consumption for the increasing of population and economy mainly lies on three indicators: population increasing, economy development and agriculture development. We are to determine an optimal increasing model of the population and economy of Zibo city based on the water resources and available water resources in this region. For such purpose, some basic assumptions and known data are given in the follows (see [6]).
(1) According to the geology and hydrology conditions, we divide Zibo into three sub-districts: middle district (MD in short), south district (SD in short) and north district (ND in short); and the average water resources and available resources in each district are all known.
(2) Taking 1997 as a datum year, in this year there are 401.03 (unit: ten thousands) people in Zibo, and there are 173.86 ten thousands urban people; and the middle district (MD), south district (SD) and north district (ND) have 157.54, 11.10 and 5.22 ten thousands people respectively. There are 227.17 ten thousands county people in Zibo, and there are 153.19 , 43.89 and 30.09 ten thousands people in the districts MD, SD, and ND respectively. In addition, according to the situation of water demand for each people and the increasing trend of population of Zibo, a ration water supply plan for each people in the three districts is given below. Where D denotes district, Y denotes year, and the unit l/p.d means one litre for each people every day.
Tab 2.1 Ration water supply in 2005 and 2010(l/p.d)
|
D Y |
MD |
SD |
ND |
|||
|
urban |
county |
urban |
county |
urban |
county |
|
|
2005 |
180 |
90 |
160 |
80 |
160 |
80 |
| 2010 |
230 |
120 |
210 |
100 |
210 |
100 |
(3) In 1997, the total industrial production value of Zibo is 849.87 billion Yuan, where urban industrial production value is 359.23 billion Yuan, county industrial production value is 490.64 billion Yuan. The production values of the districts MD, SD and ND are listed below respectively.
Tab 2.2 Industrial production value in 1997(unit: billion Yuan)
|
District
|
MD |
SD |
ND |
|
Urban industry |
331.57 |
17.55 |
10.11 |
|
County industry |
467.83 |
13.19 |
9.62 |
According to the actually statistical data, water quantity consumed by Ten thousands Yuan production value (TTYPV in short) is decreasing markedly year after year. In the following table, water quantity consumed by every TTYPV for urban industry and county industry for each sub-district in 2005 and 2010 are predicted. Where the deterministic ration of water quantity consumed by urban industries are predicted by two-order index smooth method according to the developing trend of urban industries, and the water ration for county industries are determined by the actually developing situations of the county industries.
Tab 2.3 Water ration consumed by TTYPV in 2005 and 2010(unit: m3)
|
D
Y |
MD |
SD |
ND |
|||
|
urban |
county |
urban |
county |
urban |
county |
|
|
2005 |
36.27 |
35 |
53.93 |
40 |
53.21 |
35 |
|
2010 |
27.45 |
25 |
37.61 |
30 |
37.14 |
25 |
(4) In 1997, there are three millions and thirty thousands farm areas in Zibo. The total irrigating farm is 242.07 (ten thousands areas), where the effective irrigation is 223.44 (ten thousands areas), the water ration for irrigating is 395 m3 per area. According to the economic plan for farm irrigation of Zibo, the irrigating ration is to be decreased gradually. In 2005 and 2010, the farm irrigating consumptions under different precipitation probabilities are given as below, where the unit TT means ten thousands.
Tab 2.4 Water consumptions for irrigation in 2005 and 2010 (TT m3)
|
D CP |
MD |
SD |
ND |
|||
|
2005 |
2010 |
2005 |
2010 |
2005 |
2010 |
|
|
50% |
51317.75 |
47640 |
7721.20 |
8880 |
20966.52 |
19500 |
|
75% |
56998.24 |
52880.4 |
8673.47 |
9975.2 |
23762.1 |
22100 |
|
95% |
63159.42 |
58597.2 |
9291.17 |
10685.6 |
25858.95 |
24050 |
(5) For water consumptions by stockbreeding, we are only concerned with large livestock. In 1997, there are 37.06 TT of large livestock, and the number is increasing with the development of stockbreeding year after year, but for single livestock, its demand for water supply is unchanged. Suppose each livestock needs forty liters for each day, then by the developing trends of stockbreeding in Zibo, the water consumptions for stockbreeding in 2005 and 2010 are estimated as follows (unit: TT m3):
Tab 2.5 Water consumptions for stockbreeding in 2005 and 2010
|
D Y |
MD |
SD |
ND |
|
2005 |
301.344 |
292 |
52.56 |
|
2010 |
345.144 |
335.8 |
65.7 |
(6) According to the water engineering plan of Zibo, available water quantities in 2005 and 2010 are predicted below under different precipitation probabilities:
Tab 2.6 Available water supplies in 2005 and 2010(TT m3)
|
D |
CP |
Y |
|
|
2005 |
2010 |
||
|
MD |
50% |
124334 |
140618 |
|
75% |
110365 |
126649 |
|
|
95% |
92851 |
109135 |
|
|
SD |
50% |
18747 |
20386 |
|
75% |
14133 |
15772 |
|
|
95% |
9170 |
10809 |
|
|
ND |
50% |
25768 |
25788 |
|
75% |
24739 |
24759 |
|
|
95% |
23284 |
23304 |
|
|
Total |
50% |
168849 |
186792 |
|
75% |
149237 |
167180 |
|
|
95% |
125305 |
143248 |
|
Under the above constraints of available water quantities, we will construct an optimal model on the indicators of industry, agriculture and population, and then to determine optimal increasing rates of industrial economy and population in Zibo. Some variables are defined as follows. Where IPV denotes industrial production value; TTYPV also represents ten thousands Yuan production values.
Y-total IPV, Y=Yu+Yc; Yu-urban IPV, Yc-county IPV;
R-increasing rate of IPV; Ru-increasing rate of urban IPV; Rc-increasing rate of county IPV;
P-intrinsic increasing rate of population;
Pu-intrinsic increasing rate of urban population; Pc-intrinsic increasing rate of county population;
X-total consumption water;
Xui-consumption water of urban industry; Xuim-consumption water of urban industry in MD; Xuis-consumption water of urban industry in SD; Xuin-consumption water of urban industry in ND;
Xci-consumption water of county industry; Xcim-consumption water of county industry in MD;
Xcis-consumption water of county industry in SD; Xcin-consumption water of county industry in ND;
Xul-consumption water of urban living; Xulm-consumption water of urban living in MD; Xuls-consumption water of urban living in SD; Xuln-
consumption water of urban living in ND;
Xcl-consumption water of county living; Xclm-consumption water of county living in MD; Xcls-consumption water of county living in SD; Xcln-consumption water of county living in ND;
Xfi-consumption water of farm irrigation; Xfs-consumption water of farm stockbreeding;
W-total available water quantity;
T-consumption water by TTYPV of industry;
Tu-consumption water by TTYPV of urban industry;
Tum-consumption water by TTYPV of urban industry in MD;
Tus-consumption water by TTYPV of urban industry in SD;
Tun-consumption water by TTYPV of urban industry in ND;
Tc-consumption water by TTYPV of county industry;
Tcm-consumption water by TTYPV of county industry in MD;
Tcs-consumption water by TTYPV of county industry in SD;
Tcn-consumption water by TTYPV of county industry in ND.
With help of the above variables, the problem is reduced to a maximal problem: max Y. That is to determine the parameters R and P such that the total IPV can reach its maximum. Considering the constraints of limited water resources, we get the following optimal problem:
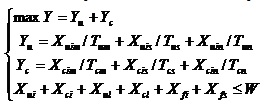 (1)
(1)
3 Optimal Control for Increasing Rates of Industry and Population
By the limited available water resources and a suitable rate of population, we are to solve the above optimal problem (1) with help of MATLAB tool, and then to get the optimum increasing rates of IPV in 2005 and 2010 respectively. Firstly, the requiring water quantities of considering items are computed and listed in the following table.
Tab 3.1 Computation of water requirements in 2005 and 2010
|
Variable |
Variable Values (TT m3) |
||
|
2005 |
2010 |
||
|
Xui |
Xuim |
331.57*(1+ Ru)8*36.27 |
331.57*(1+ Ru)13*27.45 |
|
Xuis |
17.55*(1+ Ru)8*53.93 |
17.55*(1+ Ru)13*37.61 |
|
|
Xuin |
10.11*(1+ Ru)8*53.21 |
10.11*(1+ Ru)13*37.14 |
|
|
Xci |
Xcim |
467.83*(1+ Rc)8*35 |
467.83*(1+ Rc)13*25 |
|
Xcis |
13.19*(1+ Rc)8*40 |
13.19*(1+ Rc)13*30 |
|
|
Xcin |
9.62*(1+ Rc)8*35 |
9.62*(1+ Rc)13*25 |
|
|
Xul |
Xulm |
157.54*(1+ Pu)8*65.7 |
157.54*(1+ Pu)13*83.95 |
|
Xuls |
11.10*(1+ Pu)8*58.4 |
11.1*(1+ Pu)13*76.65 |
|
|
Xuln |
5.22*(1+ Pu)8*58.4 |
5.22*(1+ Pu)13*76.65 |
|
|
Xcl |
Xclm |
153.19*(1+ Pc)8*32.85 |
153.19*(1+ Pc)13*43.8 |
|
Xcls |
43.89*(1+ Pc)8*29.2 |
43.89*(1+ Pc)13*36.5 |
|
|
Xcln |
30.09*(1+ Pc)8*29.2 |
30.09*(1+ Pc)13*36.5 |
|
Combining with the available water resources in 2005 and 2010 (see Tab 2.6), and noting to the water assumptions by farm irrigating and stockbreeding listed in Tabs 2.4-2.5, we can work out an optimal increasing rate of IPV and a suitable population increase indicator with aids of MATLAB tool. Take the year of 2010 as example, if precipitation probability is 50%, then the increases of industry and population should satisfy the following inequality:
 ,
,
where  denote the increasing rates of urban industry and county industry respectively;
  represent the increasing rates of urban population and county population respectively; and
  =10137,
  =12332,
  =14476,
  =9410;
  =186792,
 =76020,
  =746.644.
On the mathematical meanings, we know by the model (1) that the increasing rate of economy reaches its maximum if population increase becomes zero. However, the increase rate of population should be greater than zero in the present situation. According to statistical data of population of Zibo, the intrinsic rate of population belongs to 4‰-6‰, and with development of the society, this population indicator should be taken on decreasing trend. For convenience to computation, set  and
and . The predicting results for
  and
and in 2005 and 2010 under different precipitation probabilities are given below.
Tab 3.2 Prediction of increasing rates
|
Y |
2005 |
2010 |
||||
|
CP |
50% |
75% |
95% |
50% |
75% |
95% |
|
W |
168849 |
149237 |
125305 |
186792 |
167180 |
143248 |
|
R(%) |
10.62 |
3.46 |
-15.78 |
10.73 |
7.42 |
0.86 |
|
P(‰) |
5 |
2 |
0.5 |
5 |
2 |
0.5 |
In order to see more clearly the influence of population indicators to the increase of industrial economy, the changeable trends of increasing rate of industry with the increasing population in 2010 are plotted in cases of CP=50% and CP=75%.

4 Conclusions and Suggestions
4.1 Analysis of Results and Suggestions
The predictions for the increasing rates given in Tab 3.2 are reasonable and scientific. If the society and economy have the development by the above increasing rates, especially controlling the increasing rate of population lower to 5‰, then the total industrial production value (IPV) can reach a double-digit increase in an usual precipitation year, and the water resources can be utilized to a maximal extent in the case of preventing water shortage in general. However, on the concrete water supplies for each district, water surplus or shortage could appear in one of the three districts. For such cases, we give the following considerations in the case of CP=50%.
By the computed increasing rates of and in Tab 3.2, together with the known data and the developing indicators in 1997, it is easy to work out the water quantities consumed by the three districts in 2005 respectively (unit: TT m3):
MD: 131306; SD: 13327; ND: 24212.
Compared with the results in Tab 2.6, we can observe that in the case of CP=50% in 2005, MD needs to redeploy water quantities about 6972, SD can supply water quantities about 5420, and ND can supply water resources about 1556.
Similarly, we can work out the water quantities consumed by the three districts in 2010 respectively (unit: TT m3) as follows:
MD: 147501; SD: 15805; ND: 23482.
Also compared with those in Tab 2.6, we know that in 2010y of usual precipitation, the MD needs redeploy water resources about 6883, SD can supply water quantities 4581, and the ND can supply water quantities about 2306.
4.2 Conclusions
1) In this paper, preliminary relations of water resources with development of society and economy of Zibo are investigated from view of sustainable development, a controllable model for increase of industry and population under limited available water resources is constructed. Moreover, optimal increasing rates of industrial production values with suitable increase rates of population are worked out which have a definite practical meaning in the case of usual precipitation year.
2) There are some deficiencies in the model and the results. Firstly, some indicators and data are excessively cursory, which affect the accuracy of the model and computation to some extent; Next, in the cases of CP=75% or CP=95% (i.e. low water year), the predicting results lose practical meanings maybe because of the localization of model factors and known data; Finally, population indicator here only has an assistant effect in the construction of the optimal model because we are mainly concerned with the increase of industrial production values; and there is a lack of considerations for industrial structure and environment limitations, etc. Therefore, the system model established in this paper should have farther modifications in the followed works.
References
[1] Cocklin C R. Methodological problems in evaluating sustainability. Environment Conservation,1989, 16(4): 343-351
[2] Moffatt I. On measuring sustainable development indicators. The International Journal of Sustainable Development and World Ecology, 1994, 1(2): 102-112
[3] Zeng Rong, Wei Yiming, et al. Analysis and assessment indicator system for harmonization development among population, resources, environment and economy. Chinese Journal of Management Science, 2000, 8 (special issue): 310-317
[4] Wei Yiming, Zeng Rong, Fan Ying et al. A multi-objective goal programming model for Beijing's coordination development of population, resources, environment and economy. Systems Engineering-Theory & Practice, 2002,22(2): 74-83
[5] Liu Changming, He Xiwu et al. Water Problem Strategy for China's 21st Century. Science Press, Beijing, 1998
[6] Zibo Water Resources Managing Office. Sustainable Utilization Researches on Water Resources in Zibo (Research Report), 1999