


Achievements
CONSTRUCTION OF THE WALL OF UNDERGROUND DAM USING CHEMICAL GROUTING- A LABORATORY INVESTIGATION
Makoto NISHIGAKI*1, Mitsuru KOMATSU*, John Apambilla AKUDAGO* and Kenji KAWAKAMI*
* Faculty of
Environmental Science,
*1 Corresponding author,
Email: makoto@gw.civil.okayama-u.ac.jp
Tel: +81-86-2518164; Fax: +81-86-2518167
Abstract: Constructing an underground dam for groundwater storage in the vadose zone requires that a good dam wall, referred to as cut-off wall, be constructed to block the groundwater flow direction downstream. The cut-off wall is made as less permeable as possible to prevent the leakage of water from the dam. The most widely used method of constructing the wall is to trench into the less permeable layer and fill it with a cement mix. However, the use of this method requires heavy machinery which may not only be capital intensive but also has environmental implications such as excessive noise. Consequently, there is the need to explore for other types of grouting techniques which are relatively cheaper and also employ less heavy equipment in their applications.
In order to carry out effective grouting, the pitch of the injection-hole, which depends on the in-situ effective porosity of the area under grouting, should be determined. Nonetheless, no accurate method exists for the determination of the in-situ effective porosity prior to grouting. A new method has been proposed to determine the in-situ effective porosity which will be used to evaluate the radius of effective grouting in a saturated condition.
A one dimensional grouting was conducted in the laboratory using silica-based chemical grout to inject into river sand as a test of the proposed method. The experiment was conducted in two stages: in saturated and unsaturated conditions using constant injection test. The grout penetration was quite smooth in the saturated condition, thereby resulting in a uniformly shaped wall. Also, no grouting injection problems were encountered at 30 and 100% saturations. However, at the 50% saturation, the injection pressure began to increase with time. The experiment was repeated using an axis-symmetrical column. The results were not very different from the trend in the previous experiment.
In this paper, the proposed new method for determining the in-situ effective porosity prior to grouting and the results of the laboratory experiments are discussed. Based on the results of the laboratory grouting, it is recommended that more effective grouting technique be used during grouting in the field by (1) grouting the saturated area first, (2) grouting the relatively low water content area in the unsaturated zone and (3) using constant pressure to grout the 50% water content zone.
Key words: Underground dam, effective porosity, grouting, saturated unsaturated soil, groundwater storage
1 Introduction
Constructing cut-off walls as barriers for the purpose of damming or blocking groundwater flow in many places in the world has attracted much attention of late (Evans and Dawson, 1999; Evans and Opdyke, 2006). For example, in the construction of underground dams, cut-off walls are very necessary in ensuring that the stored water does not leak out of the dam (Nishigaki et al., 2004; Kankam-Yeboah, 2005). The most common method to construct such walls is to trench and place cement mix or clay in the excavated pit. However, the trench and place method requires a lot of labor and machine usage, noisy and might not be suitable for constructing barriers extending deep below the ground’s subsurface. The best alternative for this laborious and less environment friendly practice is grouting.
Grouting is a method of sealing
the pores and fractures along which the soil or rock is highly permeable with
grout (Mininglife, 2004; Karol, 2003). If the grout penetration is homogeneous,
a uniform shaped wall can be attained. This will prevent leakage of water
through the wall. However, no placement technology can ensure completeness of
the engineered barrier or grouted wall (Sullivan et al., 1998; Pearlman, 1999).
Nilsson (1988) reported some leakages through cracks in some underground dam
walls in
The penetration of grout into the
soil depends on the viscosity of the grout and the sizes of the pores as well
as the rate of grout injection. For effective grouting, Karol (2003)
recommended that the opening size of the soil must be three times the particle
size in order to permit grouting. Hence, depending on the amount of water in
the grout mix, the grout could be very viscous and may not flow through the
soil or even settle at the bottom of pipe or grout pumps. The influence of
viscosity and grout settlement is much felt in cement and other solid
suspension grouts. Besides that, cement grouted walls have been reported to be
chemically reactive with sulphates (Fratalocchi et al., 2006; Evans and Opdyke,
2006). In order to reduce or solve some of these challenges, chemical grouts
could be used. Chemical grouting has been in use in Europe and
In order to contribute to the
understanding of grouting in the saturated-unsaturated zone, one-dimensional
relationship between the effective porosity and grout penetration was proposed.
A laboratory verification of the relationship was experimented on 30, 50 and
100% degrees of saturation of river sand compacted in various columns. The
results showed that it was possible to determine the effective porosity from
grouting but difficult at 50% degree of saturation. Based on the results from
one-dimensional experiment, the experiment was repeated in both
saturated-unsaturated conditions in the laboratory on an axis-symmetrical
column of river sand from
2 Laboratory Grouting
2.1 One-dimensional (1-d) grouting
River sand from
2.2 Results and discussion
Grouting was successfully carried out in the 30 and 100% degrees of saturation. However, it was very difficult to grout the sand at 50% degree of saturation. Figures 2 shows the relationship between pressure and grouting time during the experiment respectively. It was possible to obtain the effective porosity from the slopes of pressure-time graphs of 30 and 100% degree of saturation samples. The obtained effective porosity compares with values reported for same sand using other methods. Also, the grouted front was much longer in the 30 and 100% columns than that of the 50% degree of saturation case (16 cm after 19 seconds). However, grouting could not be continued due to the sharp rising pressure. Table 1 shows the results from the experiment.

Fig. 1. 1-D Experimental setup (unit: mm)
Fig. 2. Pressure-Time graph for 30, 50 and 100 % degrees of saturation
Table 1 Rresults from 1-D experiment
|
Degree of saturation |
Grout flow (cm3/s) |
PermeabilityK (cm/s) |
Effective porosity ne | |
|
30 |
2.55 |
3.03 x10⁻⁷ |
0.25 | |
|
50 |
2.38 |
4.77 x10⁻⁷ |
- | |
|
100 |
2.69 |
3.86 x10⁻⁷ |
0.33 |
In order to have a wider picture of grouting in space and time, the experiment was repeated in an axis-symmetrical column in a saturated-unsaturated condition
3.1 Material requirement and sample preparation for axis-symmetrical experiment
The materials which were used in
the experiment include: Axis-symmetrical column of 50 cm diameter, A 40 cm
diameter lining mesh, injection pipe, injection pump, silicate liquids A and B,
river sand from
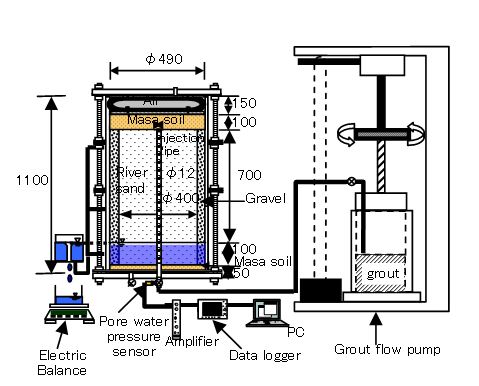
Fig. 3. Laboratory experimental set (unit: mm)
The Masa soil was first compacted into a 50 cm diameter column up to 5 cm. River sand of porosity of 0.4 and a permeability of 3.53x10⁻² cm/s was compacted in the lining mesh which was placed on top of the compacted Masa soil as shown in Fig. 4. The annular space between the mesh and the inner wall of the axis-symmetrical column was filled with gravel.
The experimental sample was saturated and later drained. An assumed groundwater level of 15 cm from the bottom of the Masa soil was maintained resulting in only 10 cm portion of the river sand column being saturated. Figure 5 shows the water characteristic curve of the river sand. The set-up was connected to the injection flow pump and another column containing a mixture of two different silicates liquids A and B.
3.2 Laboratory experimentation
The prepared sample was grouted using the constant flow rate method. Grout was supplied from the grout mix into the sample with the aid of pressure from the flow pump. Figure 4. shows the setup for the grouting process. The grouting lasted for about two (2) minutes and the resulted content was allowed to stay for 48 hours to solidify. The gel time was actually determined by monitoring the remaining grout mix which became solidified after 48 hours hence, suggesting that the grouted material had also become solidified.
The mesh and the mould were taken off from the solidified grouted sand and the loose sand was washed away until the true shape of the grouted zone was got as shown in Fig. 6.
In order to critically examine the physical properties of the grouted material in time and space, the solidified grouted sand was divided in to four zones. The zones were the saturated zone (10 cm from the top of the Masa soil), the capillary zone, unsaturated zone (nearly equal air and water contents) and the unsaturated zone with the residual water content as indicated in Fig. 6. Four samples each were taken from all these zones for effective porosity of grout and permeability analysis.
3.3 Porosity
Each sample was trimmed to about 5 cm in diameter and 9 cm long. With the aid of a string of negligible weight, each sample was fastened and immersed into a cylinder of known volume of water. The change in volume was noted. The change in volume represented the volume of solids in the grouted sand. If the change in
volume was denoted by V2 and the volume of sample calculated from the known sample diameter and length was V1, then,
The effective porosity (ne) is given by equation (1) below.
![]() (1)
(1)
The experimental results of the effective porosity are shown in Table 2.
Table 2: Summary of experimental results
|
Zone |
1 |
2 |
3 |
4 | |
|
Radius of grouted front (cm) |
18 |
16 |
10 |
8.5-16 | |
|
Effective porosity of grout |
0.2 |
0.25 |
0.35 |
0.16 | |
|
Initial porosity |
0.4 |
0.4 |
0.4 |
0.4 | |
|
Axis-sym. |
8.83 X10⁻⁵ |
4.77 X10⁻⁵ |
2.209 x10⁻³-1.38 x10⁻⁴ |
2.94x10⁻³ | |
3.4 Permeability
The samples used for determining the porosity above were further trimmed down to lengths below 5 cm. The permeability of each sample was measured using the tri-axial falling head permeability test method. Prior to the permeability measurements, each sample was saturated for twenty-four hours with a cell pressure of 10 KPa.
4 Results and Discussion
The shape of the grouted sand in the mould assumed a conical shape. A comparison between the water characteristic curve and the shape of the grouted sand in Figs 5 and 6 respectively show that the part immediately after the capillary zone shrank in diameter. The radius of grouted front varied from averagely 10 in the unsaturated zone to about 18cm in the saturated area. The details are shown in Table 2.
The measured effective porosity of the grouted sand varied from 0.16 to 0.35. Comparing the results of the effective porosity with the shape of the grouted sand, the samples from zone 3 had higher values of effective porosity but decreased in zone 1, 2 in the saturated area and zone 4 in the unsaturated area. It was observed that where the radius of grouted material was large, the grouted sand was more porous than the middle section where the radius was small (Table 2). This suggests that grout movement in the sand during grouting is a process of displacing the original fluid in the soil, and it is easier displacing only water or only air than both fluids combined. Karol (1961) stated that under ground water level, grout penetration depends on the permeability of water in each soil character but depends on both the permeabilities of water and air in the un-saturated region. Hence, when grouting in un-saturated regions, it is necessary to consider the degree of saturation. As seen from Fig.6, the displacement was much in the saturated zone than the unsaturated zones (less than 30% degree of saturation).
As was reported in (Brace, 1984, Rovey and Cherkauer, 1995, Zhang et al., 2000, Martinez-Landa et al. 2000, Illman et al, 2003) about variation of permeability with scale, the permeability values of the grouted sand also varied within the various zones. The permeability ranged from 10-3 to 10-5 cm/s. Permeability decreased from the unsaturated zone to the saturated zone. The permeability in zone 3 was not uniform. The values range from 10-4 to 10-3 cm/s. However, the permeability in the 1-D grouting was 10-7 cm/s for the all the samples. The difference in permeability between the axis-symmetrical and 1-D grouting might have resulted from the fact that the area is quite smaller in the 1-D and grout does not travel far to settle.
The non uniform shape from the experimental grouting shows how difficulty it will be in predicting the exact radius of grouting front during field grouting. This would influence the performance of the dam wall or barrier. The upper and lower portions of the grouted area of each successive grout holes will intersect but the mid portion could be hollow. This can result to leakages through the mid portion or the 50% saturation area. Generally, both 1-D and axis-symmetrical column experiments showed similarities in the grout permeation in 100, 30 and 50% degrees of saturation.
5 Conclusion
The laboratory grouting under constant flow rate using chemical grout in both the axis-symmetrical and 1-D columns have demonstrated that, grouting soils with chemical grouts produces shapes which depend on the amount of water or air present in the soil. Based on the experiments, the following conclusions were deduced:
(1) The effective porosity of the soil to be grouted can be obtained by a one dimensional grouting at 100 or 30% degree of saturation.
(2)Both experiments show that grouting soils at 100 or 30% degree of saturation are much easier than those at 50%.
(3) The permeability and porosity of the resulting barrier or wall have shown that dam walls or
barriers are never uniform and vary in its properties with scale.
(4) Although a relationship between injection pressure and grout penetration was not established in the axis-symmetrical experiment, previous works using the 1-D suggest the mid portion (shrank part in Fig. 6) required some amount of pressure different from the other zones to force more grout into.
Based on the results of the laboratory grouting, the authors propose that field grouting should be carried out in stages: (1) grout the saturated area first, (2) grouting the relatively low water content area in the unsaturated zone and (3) using constant pressure to grout the 50% water content zone. This may ensure uniform shape wall.
![]()

Fig. 5. Water characteristic curve of sand

Fig. 6. A photo of the solidified grouted sand
References
[1] Bolisetti, T., and Reitsma, S. (2006). Numerical Simulation of Chemical Grouting in Heterogeneous Porous Media. http://socr.uwindsor.ca/~boliset/grout2003paper.pdf (2006).
[2] Brace, W.F. (1984). Permeability of crystalline rocks. New in situ measurements. Journal of Geophysical Research, 89(B6):4327-4330.
[3] Clement, T.P. (1997). RT3D, A modular computer code for simulating Reactive multi-species Transport in 3-Dimensional groundwater aquifers, Pacific Northwest
National Laboratory,
[4] Evans, J.C., and Dawson, A.R. (1999). Slurry walls for the control of the contaminant migration: A comparison of United Kingdom and United States practices, ASCE specialty conference on Geo-Engineering for underground Facilities, ASCE Geotechnical Special Publication No. 90.
[5]
Evans, J.C., and Opdyke, S.M.
(2006). Strength, Permeability and Compatibility of Slag-Cement-Bentonite
Slurry Wall Mixtures for constructing vertical Barriers 118-125: In 5th
ICEG Environmental Geotechnics edited by Thomas H.R. Thomas Telford Publishing,
[6] Finsterle, S.,
"Mathematical modeling of permeation grouting and subsurface barrier performance", Intl Containment Tech. Conf. and Exhibition, Feb 9-12, 1997, pp.438
[7]
Fratalocchi, E., Pasqualini, E.,
and Balboni, P. (2006). Performance of a cement-bentonite cut-off wall in an
acidic sulphate environment 133-139: In 5th ICEG Environmental
Geotechnics edited by Thomas H.R. Thomas Telford Publishing,
[8] Illman, W.A., Neuman, S.P., Vesselinov,V.V., and Guzman, A.G. (2003). Strong evidence for permeability scale effect in fractured rock, 437-442 in Groundwater Engineering- Recent advances, edited by Kono, I., Nishigaki, M., and Komatsu, M, A.A Balkema Publishers, Netherlands.
[9]
Kankam-Yeboah, K. (2005),
Research on underground dams-Design and Construction Concerpts, A PhD thesis
(unpubl),
[10] Karol, R.H. and Swift, A.M. (1961). Symposium on grouting in flowing water and stratified deposits. Journal of the Soil Mechanics and Foundations Division, Proceeding of the American Society of Civil Engineers, Vol.87 No. SM2, pp125-145
[11]
Karol, R.H. (2003), Chemical
Grouting and Soil Stabilization, 3rd ed. Marcel Dekker, Inc.,
[12] Kim, M. and Corapcioglu, M.Y. (2002). Gel barrier formation in unsaturated porous media. Journal of Contaminant Hydrology vol.56 pp 75-98.
[13] Martinez-Landa, L., Carrera, J., Guimera, J., Vazquez-Sune, E.,Vives, L., and Meier, P. (2000). Methodology for hydraulic characterization of a granitic block, 340-345, in Calibration and Reliability in Groundwater Modelling; Coping with Uncertainty, ModelCARE 99, edited by Stauffer, F., Kinzelbach, W., Kovar, Kand Hoehn, E. IAHS Publication 265, IAHS Press, Wallingford, Oxford-shire, UK.
[14] Mininglife (2004). Grouting overview, http://www.Mininglife.com/Miner/rockmec/grouting/rock_grouting_theory.htm
[15]
Nilsson, A. (1988). Groundwater
dams for small-scale, Intermediate Technology Publications Ltd.,
[16] Nishigaki, M., Kankam-Yeboah, K., and .Komatsu, M. (2004). Underground dam technology in some parts of the world, J. groundwater hydrol., 2, pp113-130.
[17] Noll, M.R., Bartlett C., Dochat, T.M. (1992). "In situ permeability reduction and chemical fixation using colloidal silica", Presented at the 6th Natl. Outdoor Action Conference on Aquifer Restoration,
[18]
Pearlman, L. (1999). Subsurface containment and monitoring
systems: Barriers and beyond, OSWER, Technology Innovation of Office, USEPA,
[19] Rovey II, C.W., and Cherkauer, D.S. 1995. Scale dependency of hydraulic conductivity measurements, Groundwater 33: 769-780.
[20] Sullivan,T.M., Heiser, J., Gard, A. and Senum, G., (1998) "Monitoring subsurface barrier integrity using perfluorocarbon tracer," J. of Environ. Engg., 124(6), 490-497.
[21] Zhang, D., Zhang, R., Chen, S., and Soll, W.E. (2000). Pore scale study of flow in porous media: Scale dependency, REV, and statistical REV, Geophys. Res. Let., 27:1 195-1198.
APPENDIX
Consider a one-dimensional column as shown in Fig. 1 below with grout being injected at the left hand side under saturated condition.

Fig.1. One-dimensional constant flow rate under saturated condition
Under a constant flow rate injection in a one-dimensional condition, the flow rate Q is related to the effective porosity (ne) by equation (A1)
![]() (A 1a)
(A 1a)
![]() (A1b)
(A1b)
![]() (A1c)
(A1c)
Where q is the flux (cm/s) and equal to Q/A
A is the cross sectional area of flow
L(t) is the permeation front at time t (s)
ne is the effective porosity of the soil under grouting
In a saturated condition, the flow of grout is given by
![]() (A2)
(A2)
Where, kg (cm/s) is the permeability of grout in soil under grouting
Integrating Eqn. 3

![]() (A3)
(A3)
Also, the flow of water during grouting is given by
![]() (A4)
(A4)
Where kw is the permeability of water in the soil under grouting
Integrating Eqn. 5,
 (A5)
(A5)
![]() (A6)
(A6)
The total flow during the grouting is the sum of the grout and water flows in the soil under grouting. Hence combining Eqns. (A4) and (A7) gives Eqn (A8)
![]() (A7)
(A7)
Substituting Eqn 2 for L(t) in Eqn. (A7) gives Eqn. (A8)
![]() (A8)
(A8)
A graph of h0(t) against time t gives a straight line with gradient M and intercept B.
![]() (A9)
(A9)
Hence,
![]() (A10)
(A10)
And the intercept B is given by Eqn. (A12).
![]() (A11)
(A11)