Groundwater with Its Sustainable Development
SURFACE AND GROUNDWATER USES IN RURAL AND URBAN AREAS OF PORTUGAL
Chambel, A.
Geophysics Centre of Evora, Department of Geosciences,
University of Evora,
Apartado 94, 7002-554
Abstract:The water problem in countries like Portugal, with asymmetric regional and temporal distribution of precipitation (North/South) and asymmetric distribution of population (coastal urban areas/inner areas) is of no easy management. The urban supply water politics in
Agriculture is clearly the main user of water resources in Portugal (87 % of the total), against 8 % of the urban supply water and 5 % of the industry, but, in terms of costs, the urban supply water represents much more financial effort them any other activity, due to water and wastewater treatment necessary for that purpose.
The total costs of water inefficiency represented, in 2001, a calculated value of 39 % of the total yearly estimated water value. This is the water fraction that must be under better management in order to try to avoid so much economic losses.
Key words: surface-and groundwater uses,
1 Introduction
Groundwater uses in rural and urban areas of South Portugal has changed in the last decades. Till the eighties, the water supply systems were mostly based on groundwater. But, with most part of the territory based on hard rocks, the increasing water demands and the climatic conditions, political and technical decisions led to the increasing use of surface water, permitted by the construction of a net of dams, the biggest one with a total capacity of 4,150 hm3 and a water surface of 25,000 hectares, built on the turn of the 20 to 21 century, the Alqueva dam, that will permit the urban supply to a large net of villages in one of the most dry regions in South Portugal. It will also permit the irrigation of 110,000 hectares of land. Partially this will substitute areas that previously had irrigation based on groundwater, but mainly it will permit to irrigate new areas.
The first effect of this politics was the substitution of the groundwater supply to the bigger cities (between 20,000 and 50,000 inhabitants) for surface waters and, in the last years, with the privatisation of the water supply systems, more and more villages are using surface waters.
2 General Characterization
of the
The Portuguese continental
territory represents 89,300 km2
e has a form roughly rectangular, with a dimension between approximately 560 by
220 km (INAG 2005). It is
situated on the western part of the Iberian Peninsula, western part of Europe, between the meridians 6º W and 10º W and between
the parallels 37º N and 42º N. Its border is with the Atlantic Ocean at West
and South and with
The climate in Portugal puts together the atlantic and Mediterranean influence, the first one responsible by high precipitation levels in the winter, essentially on the NW part of the country, and the second one responsible by high temperatures and low precipitation levels in the summer (INAG 2005).
The average total precipitation
value in
Figure 1. Position of
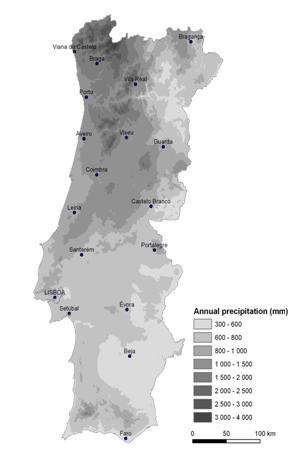
The spatial distribution of the precipitation shows that the more rainy regions are present on the NW part of the territory, where the precipitation can reach average mean values higher than 2,800 mm. On the other northern parts of the territory the precipitation values are between 1,200 and 1,400 mm on the high lands and are less than 500 mm on the low lands (figure 2).
On the central part of the country, two areas of high relief are present, where the precipitation can reach 2,400 mm in an average year. On the south the average precipitation can vary between 800 and 1,200 mm in mountain areas and can reach a minimum of 400 mm on the south coast (INAG 2005).
The precipitation is concentrated in the period between October and March. The highest values correspond to the months of December and January and the lower values occur in July and August. Big variations can also occur from one year to the other, putting sometimes all the country in a situation of severe dryness and, other times, flood problems or torrential rains can occur.
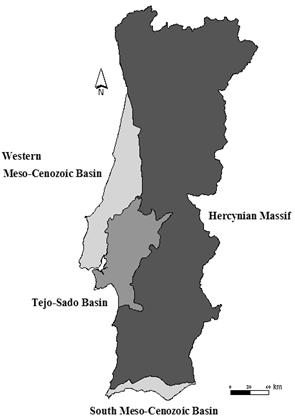
The Portuguese territory is formed by 3 geologic unities: igneous and metamorphic rocks of the Hercynian Massif, the sedimentary rocks of the Meso-Cenozoic western and south basins and the Tertiary rocks of the Tejo-Sado basin (figure 3).

The first unit represents about 1/3 of all the country
and is formed by pre-Mesozoic terrains (metamorphized and deformed pre-Cambrian
and Palaeozoic rocks), partially covered by more recent formations (Teixeira
& Gonçalves 1980). The main litologies are igneous rocks (granites to
gabbros, andesites, etc.), metamorphic rocks (schists, shales, greywackes,
quartzites, gneisses, etc.) and sedimentaries (cover deposits) and
meta-sedimentaries (meta-conglomerates) rocks.

The main direction of the structural hercynian
features is NW-SE and, more recently, the Alpine Orogeny created some NNE-SSE
direction fault structures, some with high interest on the hydrogeologic
prospecting, namely on the specific area of the mineral waters.
Figure 2 – Distribution of the precipitation in continental
The Meso-Cenozoic basins are composed by sedimentary rocks like limestones, dolomites, marles, clay, arenites, conglomerates, etc., intersected in many places by eruptive intrusions and volcanic rocks.
The more recent cover rocks (terraces, alluviums, ancient beaches) are formed by sand, clay, gravel that fulfil the ancient fluvial valleys, forming big deposits, as the tertiary and quaternary basin of Tejo-Sado.

Figure 3.
The main geologic features of the Portuguese territory (the Hercynian Massif is
an igneous and metamorphic Palaeozoic massif; all the other unities are
represented by sedimentary rocks).
3 Hydrogeology
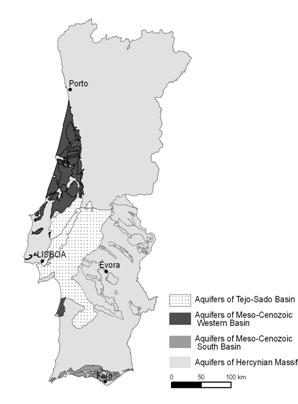
On the Hercynian Massif
(figure 4) the aquifers are highly dependent on the fracturation, kind and deep
of the weathering layer. The most ancient and basic rocks are the most
productive ones, specially when affected by late orogenic movements, like the
Hercynian and Alpine orogenies. Between them, the most productive ones are
metamorphic limestones that occur on the south half of the country (they
present median yields of about 0.8 to 5 L/s
and the transmissivity can go to 4,000 m2/day)
and some of the quartzite ridges that occur on the central part of
Considering all the less productive rocks, the median of the yields can vary between 0.5 to 1.8 L/s, representing the value of 1 L/s the considered average yield for this kind of hard rocks, at least on the south of the country (ERHSA 2001). The transmissivity values can reach a maximum near 200 m2/day.
On the Western basin (figure 4), 28 aquifers were identified, on variable geologic environments: tertiary and quaternary detritic unities, cretacic sandstones and limstones and jurassic limstones, reflected in the high heterogeinity of the aquifer systems and its hydrogeologic parameters. The median of the yields are between 0.8 and 22 L/s and the transmissivities between 20 and 1,500 m2/day, with no significant differences between the karstic and sandy aquifers.
On this basin, also some less productive areas occur, associated in generally to clay or volcanic rocks.
The South basin has 17 identified aquifer systems (figure 4), mainly karstic, with some of them mixed, karstic and porous and only two exclusively porous. Limestones, dolomitic limestones, sand and gravel form the mixed ones.
These aquifers have generally less area than the ones on the western basin, once the South basin is less extended. The median of the productivities are between 2.8 and 15.5 L/s and the medians of the transmissivity are between 5 and 1,000 m2/day, with the few registered storativity coefficient values between 10-2 and 10-4 (Almeida et al. 2000; SNIRH-INAG 2005).
Also some less productive areas occur in this area related with less permeable formations.
The Tejo-Sado basin is formed essentially by tertiary and quaternary detritic formations (figure 4), but there are also some carbonate formations. It is the most important hydrogeologic unity of the Portuguese territory and are divided in 4 aquifer systems, formed by sandstones, sand, conglomerates, gravel and some limestones and marbles.
The productivities are high, with medians between the 5 and 35 L/s and median transmissivity values between the 100 and 1500 m2/day. The storage coefficient are in scale of 10-3 (Almeida et al. 2000; SNIRH-INAG 2005).
Figure 4. Aquifers of the main hydrogeologic unities
in
4 Water Uses and Economic Consequences
The water necessities in
By sectors, based on the National Water Plan (PNA 2003), the agriculture is clearly the main water user in Portugal, with a total volume of about 6,550 hm3/year (87 % of the total), against 570 hm3/year of the urban water supply to populations (8 % of the total) and 385 hm3/year of the industry (5 % of the total).
About the effective water use costs, the urban supply systems represent the most relevant sector (46 % of the total costs), against 28 % of the agriculture and 26 % of the industry (PNUEA 2001).
But, in terms of desegregation of the uses, the biggest part correspond to agriculture, essentially on the individual use and irrigation by gravity, followed by the domestic urban use (shower, bathroom, wc discharges) and finally the transformer industry.

On the economic side, most part of the expenses
with water is related with the domestic urban uses, followed by the agriculture
individual irrigation and by the uses on the transformer industry (PNUEA 2001).
By other side, the losses in the diverse uses must be added to the costs of water treatment after use. In the case of urban water uses, the affluence coefficient is considered 0.9 and the losses 40 %. This implied, in 2001, a total cost of about 1.5 € by m3. For agriculture the cost was calculated in 0.08 € and for industry 1.25 € by m3 (PNUEA 2001).
Considering the relative importance of the water uses, the main total one year costs are:
- 855 m€ for urban supply
- 524 m€ for the agriculture
- 481 m€ for the industry
In the case of agriculture, the resulting costs don’t consider the contaminated water losses that return to the environment and the respective economic consequences for the environment or respective treatment, by impossibility on the calculation of the quantities of water that return to the hydrogeological cycle. For the industrial water the costs considered the uses of the public supply water (16 % of the consumption) private water (84 %) and the drainage and treatment of the waste water, considering an affluence coefficient of 0.8 % (PNUEA 2001).
5 Water Management Problems
Explained the problematic of:
-the groundwater potential and spatial
distribution on
- the asymmetric spatial and timing distribution of the precipitation on the territory (North/South);
- the asymmetric spatial concentration of the population (coastal/inner areas);
and considering that:
-
- some of the coastal areas can, in summer, have 5 to 10 times more population than in the winter season;
- almost all the industries are located near the coastal areas;
the asymmetric surface- and groundwater distribution is a big problem and an issue that must be managed carefully.
So, the biggest cities (on the western/central-north coast) are now almost completely dependent on surface water supply, with the big artificial lakes over the Hercynian Massif and tens of kilometres of tubes transporting the water.
The south province (
The main fractured aquifers (crystalline limestones, gabbros, gneisses, etc.) will continue to supply water to some villages (till 10,000 inhabitants), and the more isolated villages will also continue to use water from other less productive fractured aquifers, once they need low water volumes.
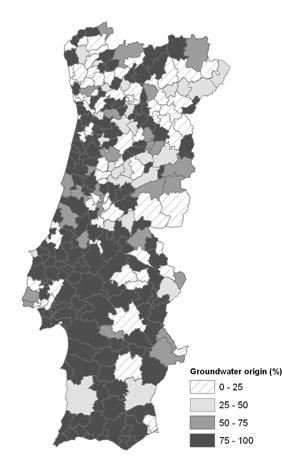
In 2004 about 45 % of the
public supply water in
On what concerns the use for industry, the surface origins represent about 55 % of the total volume, on a total of 206 hm3 and the groundwater origins represent about 179 hm3.
The agriculture is the
higher consumer of water in
The management between
surface and groundwater is not done in
The actual politics is to implement the surface water uses for urban consumption in all the big places and near the tubes linking the lakes and these defined places. Places with less than 2 or 3,000 inhabitants, if far way from the tubes, are object of studies trying to show if it is sustainable to guarantee the supply systems based on groundwater or if it is necessary to invest on new distribution nets.
In terms of opportunities to save water on the different sectors, the agriculture is responsible by 88 % of all the losses (2,750 hm3/year), against 240 hm3/year of the urban supply systems (8 %) and 112 hm3/year of the industry (4 % of the total). But, in terms of economic losses, it is the urban sector that is the most important one, with 369 m€/year (51 % of the total), followed by the agriculture, with 219 m€/year (30 %) and industry, with 140 m€/year, 19 % of the total. So, the total costs of the inefficiency were, in 2001, 728 m€/year, representing 39 % of the total yearly estimated water value.

Figure 5.
Percentage of groundwater use in the urban supply water to Portuguese
municipalities (based on data from APDA 2004).
6 Legislation and Groundwater Quality
The Portuguese law n. 236/1998, of the Ministry of the Environment, established the criteria and objectives of quality to protect the aquatic environment and increment the quality of the water for its main uses, namely the maintenance of the necessary quality of groundwater that support the human supply production.
The law 243/2001 introduced changes on some parameters, according the new scientific knowledge, which has caused recently some problems, like the legal change on the permitted arsenium concentration, which passed from 50 to 10 g/L, causing an increment on the number of groundwater points that are out of the law new limit. Also the new rules for the radiation contents are causing problems on many points that were previously inside the legal limits.
One of the ways why the costs of the water will go up in the future in European Union is these changes on the water laws, which reflect the recent and evolutionary knowledge about the physical-chemical characteristics of the water. Being the limits every time more restrictive, the tendency is now to increase the treatment processes, increasing the costs of the final water supply. The alternative is always also expensive, being it to drill new wells and create new infrastructures, or create new dams or new distribution systems from previous artificial lakes.
7 Final Remarks
The water problem in
countries like
The uses on agriculture and industry are many times dependent of the access to surface water or not and, in the last case, groundwater is an important alternative. Industries and agriculture use private water in high percentages, being it groundwater or surface water.
The activity of agriculture is the main water consumer and where there are more possibilities to increment measures in order to save higher percentages of water, but it is in home that most part of the cost saves will reflect, once the urban supply uses the most expensive water, due both to water and wastewater treatment.
The total costs of water inefficiency represented, in 2001, a calculated value of 39 % of the total yearly estimated water value.
Acknowledgments
I acknowledge João Nascimento (Superior Technical
Institute, Lisbon), José Paulo Monteiro (University of Algarve)
and Paulo Balsa (
References
[1] Almeida C, Mendonça J, Jesus MR & Gomes A 2000. Sistemas Aquíferos de Portugal Continental. Instituto da Água/Centro de Geologia da Universidade de Lisboa, 3 Volumes, 671.
[2] APDA 2004. Quem é Quem no Sector das Águas em Portugal. Associação Portuguesa de Distribuição e Drenagem de Águas, 154.
[3] ERHSA 2001. Relatório do Projecto “Estudo dos Recursos Hídricos Subterrâneos do Alentejo”. Comissão de Coordenação da Região Alentejo (CCRA).
[4] INAG 2005. Água em Portugal. Instituto da Água, http://www.inag.pt/
[5] PNA 2003. Plano Nacional do Ambiente. INAG, Lisboa.
[6] PNUEA 2001. Programa Nacional para o Uso Eficiente da Água. Versão Preliminar. Instituto da Água. Lisboa,204.
[7] Ribeiro L 2004. Águas Subterrâneas em Portugal Continental. Em: Manual de Engenharia Águas Subterrâneas, GRUNDFOS, Lisboa, 5-18.
[8] SNIRH-INAG 2005. Sistema Nacional de Informação de Recursos Hídricos – Instituto da Água, http://snirh.inag.pt/
[9] Teixeira C & Gonçalves F 1980. Introdução à Geologia de Portugal. Instituto Nacional de Investigação Científica, Lisboa, 475 p.


