Groundwater Quality Safety and Contamination Recovery
CHARACTERIZATION OF THE CONTAMINATION EPISODE BY DNAPL IN THE TORELLÓ ZONE (OSONA,CATALONIA, SPAIN)
D. PUIGSERVER1, J Mª CARMONA1, A. CORTÉS2, M. PETIT2 & M. ARCE1
(1) Departament de Geoquímica Petrologia i Prospecció Geològica. Grup de Geologia Econòmica i Ambiental i Hidrologia. Facultat de Geologia. Universitat de Barcelona. C/ Martí i Franquès s/n. 08028 BARCELONA.
(2) Departament de Productes Naturals, Biologia Vegetal i Edafologia. Facultat de Farmàcia. Universitat de Barcelona. Diagonal Sud, Facultat de Farmàcia, Edifici A. Av..Joan XXII, s/n. 08028 BARCELONA.
Abstract:The zone of work, is located in the municipality of Torelló about
The applied method of rehabilitation has been pumping and treatment, air stripping in one case and active charcoal in the other. From 2005 we are carrying out studies in order to characterize and model mathematically the episode to improve the strategy of rehabilitation.
The hydrodynamic characterization of the aquifer system has been centered specially in the study of the flow in the Ges alluvial aquifer that has the mayor part of contamination plume. The flow lines converge towards paleochannels indicating that these geological structures act like drain lines and permit the migration of contaminant plume.
In the monitoring made until the moment, the potential redox tends to be little oxidizing in one of the zone associated to one of the focuses, which favors the biodegradation of the PCE, as well as a progressive diminution NO3- from the north to the south and a increase in NO2- and NH4+. It is also remarkable that in that zone, the maximum concentrations of cyanide and total organic carbon (TOC) are too.
The sampling surveys carried out have allowed to state a significant diminution of the concentrations of PCE and TCE with respect to the moment at which the contamination plume in 2001 was detected. As for the TCE, it is necessary to emphasize that the concentration of TCE are significantly inferior to those of PCE although the morphology of corresponding plume is similar. It is interesting to observe that when there is a significant diminution of PCE, TCE increase because the biodegradation of PCE to TCE. Also is important to emphasize that in our surveys high concentrations of c-DCE and t-DCE have been detected. This makes think about the presence of DCE in the original DNAPL. Although downstream these zones a diminution is observed, these compounds continue persisting and experience increases, especially c-DCE, in those sectors where biodegradation of PCE to TCE was identified, indicating that the biodegradation chain continues as the presence in these zones of VC also confirms.
The analysis of the evolution of the concentration of PCE and TCE in control points, has allowed observing that there are zones in which the standardized concentrations of PCE have not experienced a significant diminution despite the remediation measures adopted. It allows to think that other mechanisms exist that give rise to incorporation or restoration of PCE to the aquifer such as desorption or dissolution of volatilized vapors in the saturated zone.
Keywords: DNAPL, chlorinated solvents, biodegradation, groundwater and soil pollution, alluvial aquifer, contaminated fractured marls.
Introduction and Background Information
In highly industrialized areas with no satisfactory management policy, the existence of episodes of soil and groundwater contamination due to DNAPL (Dense Non Aqueous Phase Liquids) is not surprising. These organic compounds are often used in industries related to treatment of metals, dry cleaning, degreasing agents and solvents.
Most of the DNAPLs are liquid compounds that are very carcinogenic and toxic. This is the main reason for their inclusion in Spanish legislation and in European Water Directives. The contamination episodes due to these compounds are one of the most serious problems affecting the environment. The classification of DNAPL made by PANKOW and CHERRY (1996), demonstrate that the organochlorated solvents employed in industry as dissolvents (RIVETT, LENER and LLOYD, 1990) are manly alkenes such as perchloroethylene (PCE) and trichloroethylene (TCE) used in metal degreasing, dry cleaning and in intermediate processes. These contaminants are responsible for numerous episodes of contamination examples of which are presented in this paper.
In order to better understand the migration of this type of polluting agent and its plume geometry, a large number of contamination studies have been carried out. Studies carried out by MERCER and COHEN (1990), COHEN and MERCER (1993), PANKOW and CHERRY (1988 and 1996) and FETTER (1993) analyzed the physico-chemical properties and multiphasic flow mobility of DNAPL. As regards these properties it is important to emphasize their greater density with respect to water, a range oscillating between 1.2 and
The superficial tension is low, which explains the relatively low capacity of retention of this type of polluting agent in the soil.
In the non saturated zone the capillarity phenomena are dominant, with very variable suction values between dry and humid sands (SCHWILLE, 1988; POULSEN and KUEPER, 1992; and COHEN and MERCER, 1993). For this reason, the DNAPL residual fraction in the non saturated zone can be variable.
These compounds are immiscible in water although they present a certain degree of solubility, which allows them to be incorporated into the general groundwater flow. Thus for example at 20º C the solubility of the vinyl chloride in water is 1.1 µg/l, the PCE is 150 µg/l, the TCE µg/l is 1100 and the TCA is 4400 µg/l.
Once they reach the water table, their greater density with respect to water allows the contaminant to continue migrating due to gravity as far as the impermeable substratum as a function of the amount spilled.
If the rocks are porous, the DNAPLs can reach the bottom of the aquifer and form a mobile pollutant free phase or can be accumulated in depressions forming a free phase pool (KUEPER ET al., 1993; BREWSTER ET al., 1995; FREENSTRA and CHERRY, 1996; and PARKER ET al., 2003).
The free phase of DNAPL moves downward following the morphologic gradient of the substratum and not as a result of the hydraulic gradient. If the impermeable substratum is fractured, the polluting agent can migrate owing to molecular diffusion through the rocky matrix, which makes remediation more difficult (O’HARA, PARKER, JØRGENSEN and CHERRY, 2000).
The partition coefficient with respect to the rest of the organic fraction in the environment changes as a function of the type of compound. Giving rise to a different degree of adsorption in the soil. Consequently a retardation is produced, which is a disadvantage in a remediation plan WHIFFIN and BAHR (1984).
This type of compound in addition undergoes natural biodegradation as observed in field studies FOCHT ET (1996); O’HANNESIN and GUILLHAM (1998) and in laboratory studies GUILLHAM and O’HANNESIN (1994); MATHESON and TRATHNYEK (1994) and WIEDEMEIER et al. (1999).
The degradation of PCE and TCE usually takes place in anaerobic conditions by means of hydrogenolysis or dehalo-elimination, although in natural conditions this process is slow. The generated hydrochemical environment during the degradation process favors cometabolism because of iron reduction denitrification.
The dehalo-elimination gives rise to by-products that are impoverished in chlorine. The last product of the chain of chlorinated alkenes is the vinyl chloride. Finally carbon dioxide is formed. Thus the PCE can give rise to TCE (FETTER, 1993), cis-1,2- dichloroethene mainly (c-DCE), vinyl chloride (CV), emphasizing the increase in the toxicity of these degradation products, and ethene (E).
These compounds are also characterized by a high volatility. Because of this property, the free phase, the adsorbed and the dissolved phases can volatilize and generate gas plumes that migrate through the unsaturated zone by molecular diffusion. However, the presence of vegetation, the humidity or the existence of layers with low hydraulic conductivity can diminish the capacity of diffusion of the vapor phase (PANKOW and CHERRY, 1996).
The low solubility and the low natural degradation rate account for the arrival of the free phase of DNAPL at the bottom of the aquifer and the residual phase can last between decades and hundreds of years (ANDERSON, JOHNSON and PANKOW, 1992).
The episode of contamination presented in this work is located in the
Contamination was detected in a water supply well in an alluvial aquifer in 2000. The concentration detected was 70 g/l of PCE, over the limits set by the European Directive 98/83/CEE, which fixes the maximum permissible limit for human consumption 10 g/l for the sum of PCE and TCE.
For this reason, the supply well was closed down January 2001 by the Catalan Water Agency (ACA), which demanded studies of characterization and site remediation. These studies, detected the existence of two pollution focuses, located at a distance of about
The applied method of remediation was based on the combined application of two ex-situ techniques, a system of pumping and subsequent treatment (air stripping or active carbon).
Since 2005, the Consolidated Group of Economic and Environmental Geology and Hydrology of the Department of Geochemistry, Petrology and Geological Exploration of the
The contamination has its origin in close to an industrial area to the north of Torelló (figure 1). In this type of contamination episode, the exact time of spill is unknown. Our observations suggest that, in the case of the area A (figure 1), the contamination occurred because of a more or less uninterrupted loss waste water through a pipe or for some point spill. On the other hand, in the area B, a direct spill was produced. The liquid spilled was predominantly DNAPL.
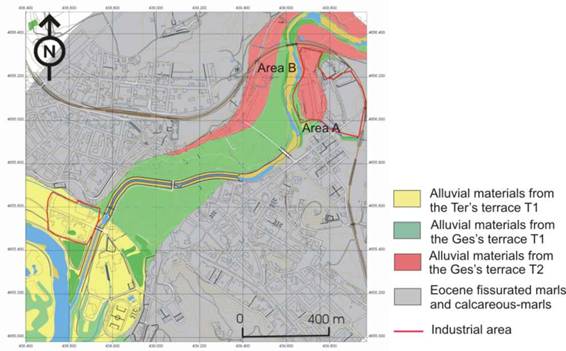
Fig 1: Situation map of the main contaminant areas close the focuses and the main aquifers.
It should be pointed out that during the preliminary studies carried out on this episode in 2001, an area of
Our aim was to carry out an integrated mathematical modeling of the unsaturated and saturated zones of the contamination episode in order to improve the strategy of remediation.
To this end, we performed an analysis of the following in the unsaturated and saturated zones: the recharge, the relationship between the aquifer water table and the river the, the pumping rate and the contents of the contaminated groundwater.
The soil and groundwater were characterized by geochemical and hydrochemical methods, as well as the biodegradation processes taking place in the contamination plume.
We present the results obtained to date concerning the characterization of the episode of contamination by DNAPL and its temporal evolution.
From the hydrogeological point of view two units can be differentiated:
Eocene Marls and fractured calcareous marls. These materials present a N-S main diaclasation and its conjugated family E-O. The hydraulic conductivity varies from 0.1 to
Alluvial Quaternary aquifer of the
Table 1 shows some of the hydraulic parameters of flow and the annual average precipitation.
Table 1: Main hydraulic parameters and characteristic values of the alluvial aquifer of the
Precipitation (mm/year) | 600 |
Hydraulic conductivity (m/day) | 20-30 |
Storativity | 0,15 |
Effective porosity | 0,15 |
The materials that form this Quaternary aquifer constitute a lower terrace (T1) which is in hydraulic connection with an upper terrace (T2). These a two terraces, despite being topographically well differentiated, from the hydraulic view, form a unit, and in both cases they are topographically higher than the present course of the rivers Ges and Ter (Figure 1).
Methodology:
The methodology to characterize the present state of the episode of contamination and the temporary evolution consisted of the following tasks:
Establishment of the temporary and space evolution of the water table. In this case we analyzed the interannual and intermonthly water table oscillations in relation to the precipitation regime and the rate of the contaminated water pumped.Soil characterization. This was made from a sampling of 10 ground profiles in the zones affected by the contamination and also in the nonaffected soil zones. In the latter the aim was to collect data concerning the original geochemical background.
Characterization and temporal evolution of the contamination of waters. This was carried out by bimonthly survey sampling in the control piezometers of the ACA and in some of private wells. During these campaigns, measures of physico-chemical parameters were made (temperature, electrical conductivity, pH and Eh), and in the laboratory (Scientific-Technical Surveys of the
From these results two hydrochemistry diagrams and maps of isoconcentrations were constructed. For the analysis of the space and temporary evolution of the contamination plume, the standardized concentrations of PCE and TCE with respect to the water table were studied and binary diagrams of PCE versus TCE were elaborated.
Results and Discussion
The results obtained to date enable us to characterize the alluvial Ges aquifer geometry in the zone where the episode of contamination originated and to characterize the evolution of hydrodynamics and hydrochemical parameters.
Water table and gradients:
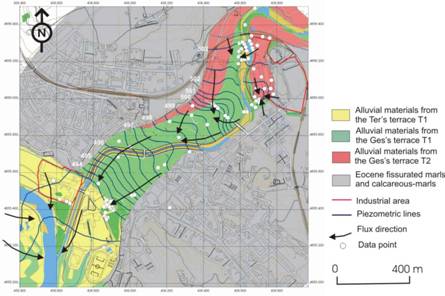
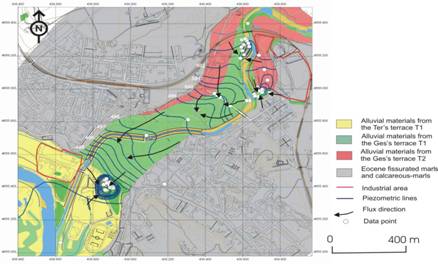
The characterization of hydrodynamics of the aquifer system was centered on the study of the alluvial Ges aquifer flow given that the major part of the contamination plume was detected in May 2001 by the ACA in this aquifer. In this sense, the comparative analysis of the water table maps corresponding to June of 2001 and April 2005 was made, before and after the implementation of the pumping-treatment system.
The water table maps, Figures 2 and 3 show that despite the existence of two terraces, these are interconnected with the result that they behave like a unique aquifer. This explains why the spill of a polluting substance in wells located in T2 terrace migrates by gravity towards the materials of terrace T1 and towards the river.
The two figures show that the potentiometric lines are inflexioned in the zones where geophysical methods in 2005 and the mechanical soundings made by the ACA in 2001 and 2002 detected the existence of paleochannels. This suggests the lines of flow converge towards them, so that these act as drainage lines along which the migration of the dissolved pollutant takes place.
In both maps, in the northeastern part, left bank of the Ges river, the potentiometric lines denote the existence of a zone of pumping that corresponds to one of the detected focuses of contamination (area A of Figure 1). In this area two pumping wells were constructed (SD35 and SD9) to pump contaminated waters and piezometers of control (SD60 occasionally used as a pumping well, SD61 that in some occasion has been used like a pumping well, and SD8). However, the water table map 2001 shows a pumping drawdown could be associate with the pumping industrial wells.
On the other hand, the water table map of 2005 (Figure 3) shows in the right bank of the Ges river the pumping cone produced by the pumping wells of this margin. These wells constitute a hydraulic barrier against the migration of the plume of contamination associated with area B (Figure 1), because the free phase of this focus was displaced and crossed the river following a paleochannel that from part of the terrace T
Table 2: Estimation of the mean hydraulic gradients, Darcy and the real velocity for the water tables studied.
| Water table 2001 | Water table 2005 | ||||
Interest zones | Hydraulic gradient | Darcy velocity Darcy (m/day) | Real velocity (m/day) | Hydraulic gradient | Darcy velocity Darcy (m/day) | Real velocity (m/day) |
Area B | 0,004 | 0,1 | 0,7 | 0,060 | 1,5 | 10,0 |
Area A | 0,023 | 0,6 | 3,9 | 0,045 | 1,1 | 7,6 |
0,019 | 0,5 | 3,2 | 0,011 | 0,3 | 1,9 | |
Town | 0,007 | 0,2 | 1,1 | 0,003 | 0,1 | 0,4 |
Pumping wells in the town (municipal park) | ------ | ------ | ------ | 0,064 | 1,6 | 10,6 |
Alluvial Ges and Alluvial Ter confluence zone | 0,011 | 0,3 | 1,9 | 0,012 | 0,3 | 1,9 |
In both cases the created pumping cones, produce in 2005 an increase in the hydraulic gradient (Figure 3) and in the real velocity of the flow (Table 2) by comparing data from 2001 and 2005. In contrast, the gradients inside the town do not vary substantially in relation to the water table of 2001 (Figure 2 and Table 2). However, in the zone of pumping and treatment that is located in the town within the municipal park, gradients and velocities are high.
Finally, in the aquifer confluence of the alluvial Ges with the alluvial Ter, gradients and velocities turn to decrease.
Water table evolution and pumping rate variations:
The study of the evolution of the water table was made using the daily data obtained in the control point network that the ACA has in the zone. Thus, Figure 4 shows the control points of area A. These often work as pumping wells, T17, SD35 and SD9, are very close to each other with the result that water table present in them the same pattern of evolution because of the existence of superposition effects.
Figure 4 also shows that the water table oscillations in the zone associated with area B (points SD57, SD18 and SD55) are smaller than those observed in area A. Also, levels of area B exceed those of area A because the wells are upstream.
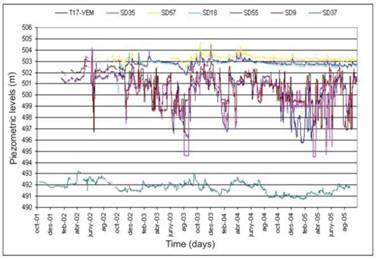
Fig 4: Evolution of the water table at the control points and pumping wells. Area A (pumping wells and control points T17, SD35 and SD9). Area B (pumping wells and control points SD18, SD55 and SD57, the last being only a piezometercontrol point). Municipal park (pumping well and control point SD37)
Figure 5 shows the response of the water table to the increase in pumping in the zone of area A. This figure
shows the rapid recovery of levels when there is a decrease in the water pumping rate, which indicates the high transmissivity of the aquifer in this sector.

Figure 5: Evolution of the water table of pumping wells located in area A and of the total and individual water pumping rate.
The same is observed in Figure 6 with respect to the levels and pumpings in the zone associated with area B.
Figure
The existence of a variable pumping regime exerts an influence on the local scale evolution of levels. In this regard, the evolution of the water table in the zone associated with area B and in the zone of the municipal park have smaller water table oscillations than area A, according with what have been observed in Figure 4.
During the period June 2002-April 2004, in area B there were water table oscillations with a good correspondence respect to the regional tendency. Since 2004, oscillations have diminished and a progressive diminution in levels has also been observed. This progressive diminution is also observed in well SD 37 located in the municipal park. (Figure 4).
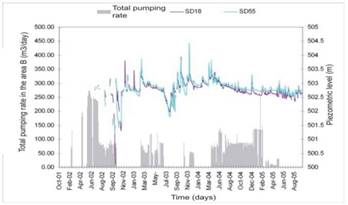
Fig 6: Evolution of water table of the pumping well associated with area B, and the total and individual water pumping rate.
Analysis of water table oscillations:
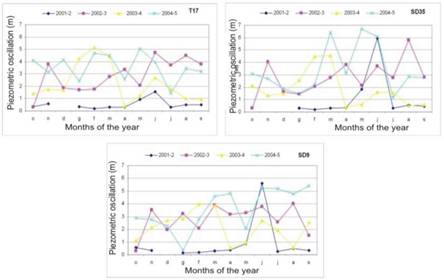
The analysis of the water table oscillations in the control points located in the zone of area A (Figure 7) suggests that the average value of the intermonthly water table oscillations of all the points ranges between 1.9 and
The years with biggest oscillations recorded in consecutive months were 2002-2003 and 2004-2005. In this case the water table oscillations are the biggest because they represent the sum of the regional tendency plus the reductions due to pumping.
At the control points located in the zone associated with area B (Figure 8), the analysis of the water table oscillations suggests that the average value of all the points varies between 0.3 and
minimum value is
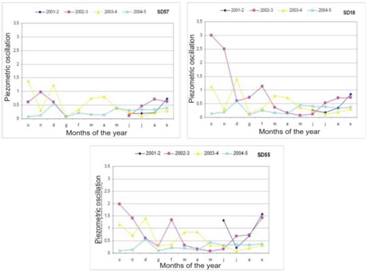
Fig 8: Evolution of the intermonthly water table oscillations in the zone associated to area B.
The months in which the biggest oscillations appear are in autumn and summer. The biggest oscillations were recorded in 2002-2003 because of a progressive diminution of the precipitation.
As for the interannual oscillations, Figure 9 show that the biggest are recorded at wells SD35 and SD9. In addition at the T17 point the oscillations tend to increase annually, whereas they diminish in the remaining points.
On the other hand, it should be pointed out that all these oscillations are the sum of a natural component and another induced by pumping. In the biggest oscillations, when the level is high, they can cause sorption in the argillaceous fraction and in the existing organic matter of the unsaturated zone.
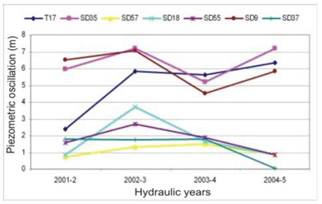
Fig 9: Evolution of the interannual water table oscillations in the control points.
In order to obtain the evidence of this sorbed fraction, soil analyses are currently being made.
Relationship between water table and rainfall:
Figure 10 shows a good correlation between the evolution of the water table and the precipitation regime.
This suggest that a part of the volatilized fraction existing in the saturated zone and can be dissolved by infiltration waters and returned to the aquifer.
Hydrochemical characterization of groundwater affected by the contamination episode:
For the hydrochemical characterization, we used major elements and physico-chemical parameters of the first sampling survey carried out in June 2001
by the ACA, and of our sampling surveys in April 2005 and November 2005.
The characterization of the predominant hydrochemical fàcies was made during the campaign of April 2005. Figure 11 shows that the groundwater located in the zone associated with area B is fairly heterogeneous whereas in the zones of area A and in the town of
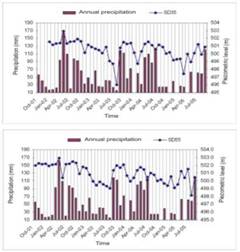
Fig 10: Evolution of water table monthly mean values in control points located in the area A (SD35) and in the zone associated to the area B (SD55) and monthly precipitation.
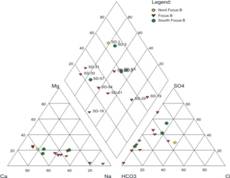
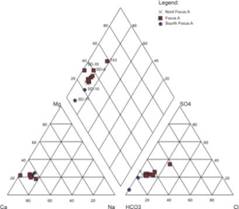
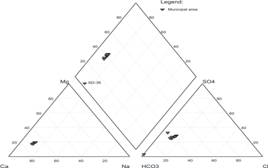
Fig 11: Piper diagram of the alluvial Ges aquifer groundwater (April of 2005).
The hydrochemical facies located upstream in the zones associated to area B are mainly calcium bicarbonated chlorided, whereas those located in front of area B range from calcium bicarbonated to sodium sulfated. The waters downstream of the area are calcium bicarbonated and sodium calcium sulfated.
The waters upstream of area A are predominantly calcium bicarbonated, whereas in the zone of area the water tends to be the more sulfated.
In the remaining sampled waters downstream of area A the predominant facies are calcium bicarbonate with a certain degree of sulfate.
The physical-chemical parameters measured show that in the zone associated with area B the control points are influenced by the river as we observe a significant diminution in groundwater temperature during the winter sampling.
The regional temperature in the zone oscillates between 10 and 17 ºC whereas the electrical conductivity ranges between 300 and 2000 S/cm, with some anomalous values above this range. It is observed that the electrical conductivity diminishes when the levels are higher. Nevertheless, in the zones where free phase still exists, an increase in the conductivity occurs because of a water table washing in the unsaturated zone.
The pH in general oscillates between 7 and 8, and undergoes few changes between spring and autumn. By contrast, the redox potential tends to be less oxidizing, with values close to 0 mV during the autumn in the zone associated with area B, which favors the biodegradation of PCE.
Characterization of the contaminant episode:
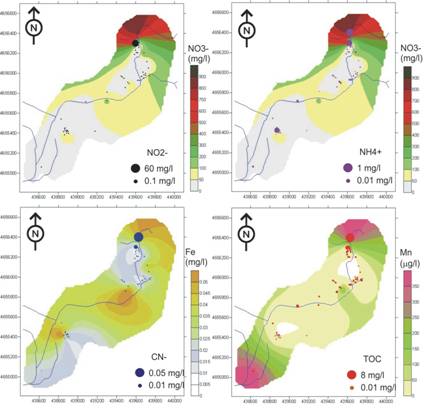
In the sampling survey carried out by the ACA in June of 2001 and in our sampling surveys of April and November 2005 and January 2006, we have been analyzed organochlorated compounds. In addition, in our sampling surveys we have analyzed also major minor and trace elements. The distribution of the nitrogen species (Figure 12, upper part), suggests a progressive diminution in the concentration of NO3- from north to south. In the zone associated with area B, the concentrations oscillate between 3 and 600 mg/l, whereas in the zone of the area A, a significant diminution is observed, oscillating between 20 and 120 mg/l. At Torelló the concentrations oscillating between 8 and 107 mg/l are observed. It should be noted that the biggest concentrations of NO2- and NH4+ (60 mg/l and 1 mg/l, respectively) are in the zone associated with area B in according with the less oxidizing conditions and with the maximum concentrations of cyanide and total organic carbon (TOC) in solution (Figure 12, upper part).
Figure 12 also shows that in the zone associated with area B, the less oxidizing conditions are not sufficient to favor the mobilization of the ionic species of the Fe and the Mn.
As regards the metal presence in solution, high concentrations of Cu, Zn are observed, Cr, Ni and Pb in the zone of the area A, with maximums in April 2005 of up to 323, 2800, 5, 20 and 10 g/l, respectively (Figure 13, 14 and 15). As for the Al in solution, the maximum concentrations are in the different contamination areaes. This could be associated with the presence of this element in the DNAPL originally spilled, given that it is used as a dissolvent in the cleaning of the mainly metallic aluminium industry of the zone.
As far the comparative analysis of the concentrations of Cu and Zn it should we noted that the concentration of the former increased in the zone associated with area B whereas it diminished in area A
during the two campaigns. In the case of the concentrations of Zn in groundwater the diminution experienced between April and November 2005 should be pointed out.
As regards the concentrations of Cr and Ni (Figure 14) the increase in the concentration of Ni in
groundwater of the zone of area A is associated with the concentration of Al in solution.
As for the organic compound concentrations in groundwater of the alluvial Ges, a significant diminution in the concentrations of PCE and TCE is observed with respect to 2001.
Figure 16 shows that in June 2001, before the start of the remediation measures, the contamination plume of PCE presented a clear continuity controlled by the flow along the alluvial aquifer. There were some sectors in which the detected concentrations oscillated between 400 and
From the sampling surveys carried out in 2005, a segmentation of the contamination plume as a result of the existence of the pumping well hydraulic barrier can be observed (Figure 17). Despite this, the PCE concentrations again increase downstream of the hydraulic barrier, indicating the possible existence of residual fraction of PCE in the soil and in the aquifer, were it is progressively dissolved.
As regards the morphology of the contamination plume it should be observed in the zone associated with the area B, two differentiated fronts (Figure 17). Both of them coincide with the existence of individual paleochannels of high hydraulic conductivity that were identified by geological and geophysical methods.
The existence in the zone of the municipal park in the south of Torelló of a second pumping hydraulic barrier by and the subsequent stripping treatment plant, (Figure 17, left side), allow to diminish the concentration of PCE below the
(Figure 18) are compared, it can be observed that there is a diminution, whereas when comparing the concentration for November 2005 and January 2006 it is observed an increase in the concentrations.
As for the TCE, it should be noted that the observed concentrations are significantly lower than those of PCE although the morphology of plume is similar to that of the PCE (Figure 19, left side).
From the point of view of the comparative analysis of the concentration of TCE in April 2005 and November 2005 (Figure 20), it should be pointed out that, in contrast to what was observed with the PCE concentration, the TCE had increased. This increase can be associated will the greater solubility of TCE with respect to PCE and that the existence of lower oxidizing conditions favoring the biodegradation of the original PCE.
The increase in the concentration of the PCE in January 2006 with respect to November 2005, corresponds to a diminution in the concentration of TCE in solution. This diminution probably takes place because of a dilution effect since the water table in January 2006 is higher and favors the incorporation of residual PCE accompanied by an increase in the TCE concentration. On the other hand, although DCE was not analyzed by ACA, its presence has been detected in the three sampling surveys (Figure 20 and 21). The high concentrations of c-DCE and t-DCE in the zone associated with area B and the lower concentrations
should be emphasized in the rest of the study zone. Downstream this zone, the concentration diminishes, although locally the concentration of c-DCE can increase as a result of the biodegradation of the TCE (hydrogenolysis process). On the other hand,
other compounds such as 1,1,1 TCA and chloroform, although not found in the campaign of April 2005, were detected in November of the same year and in January 2006 (Figure 23). These concentrations are associated with the zones where free phase was detected but their low solubility and their high volatilization can account for its absence downstream.
Cr : màxim en la zona dels
piezom del carrer (es fa
necessari dispossar del
traçat de la tuberia)
Ni: Z. A: màxim
Fig 12: Maps of isoconcentration of nitrogen species and Fe, Mn, CN- and TOC. In the upper part of the figure, the isoconcentration lines represents nitrate and dots concentrations of NO2- and NH4+. In the lower part, isoconcentration lines are Fe and Mn and dots are concentrations of cyanide and TOC. April of 2005.
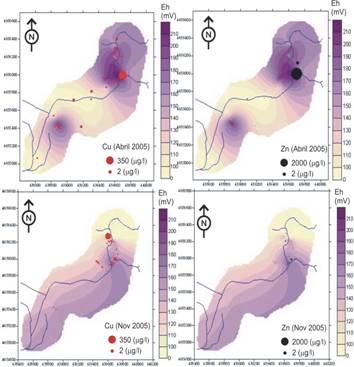
Fig 13: Maps of Cu and Zn (dots) and Eh (isovalues) for the sampling surveys of April 2005 and November 2005.
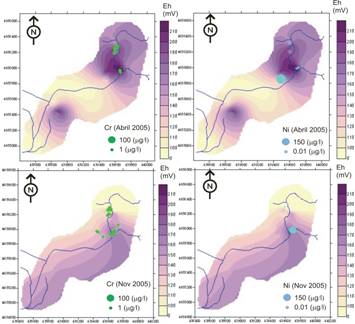
Fig 14: Maps of Cr and Ni (dots) and Eh (isovalues) for the sampling surveys of April 2005 and November 2005.
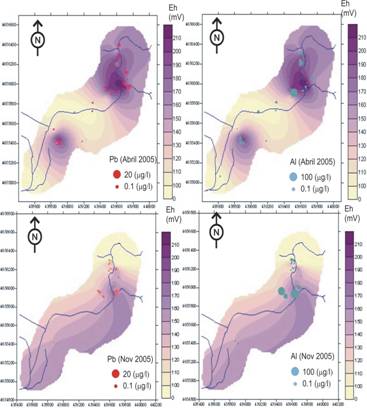
Fig 15: Maps of Pb and Al (dots) and Eh (isovalues) for the sampling surveys of April 2005 and November 2005
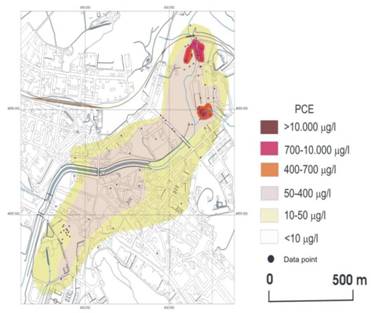
Fig 16: Map of isoconcentration (mg/l) of PCE in groundwater (June 2001).
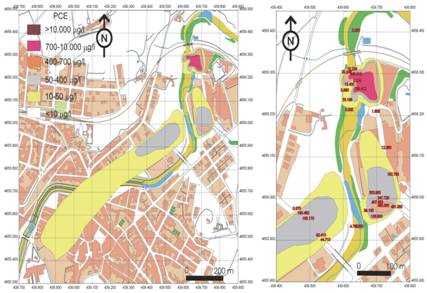
Fig 17: Map of isoconcentration (mg/l) of PCE in groundwater (April 2005).
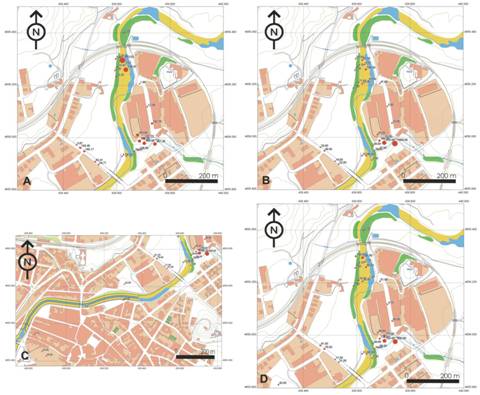
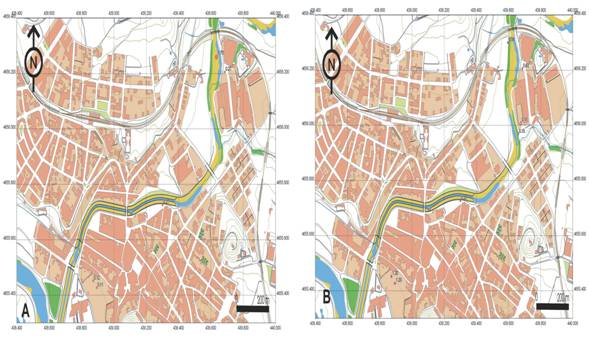
Fig 18: Maps of punctual concentrations (mg/l) of PCE. A in April 2005, B in November 2005 and C in January 2006.
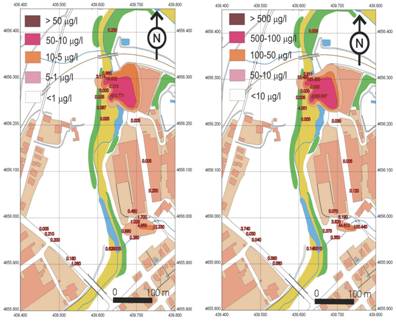
Fig 19: Maps of isoconcentration (mg/l) of TCE (left side) and cis-DCE (right side) in groundwater in April 2005.
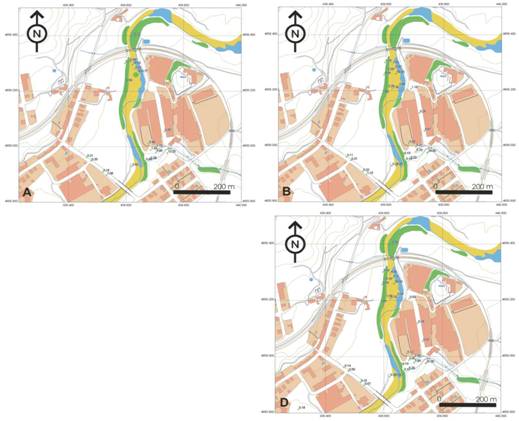
Fig 20: Maps of punctual concentration (mg/l) of TCE. A in Abril 2005, B in November 2005 and C in January 2006.
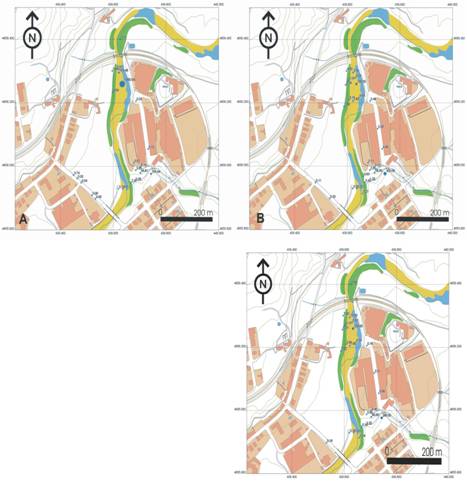
Fig 21: Maps of punctual concentration (mg/l) of cis-1,2 DCE. A in Abril 2005, B in November 2005 and C in January 2006
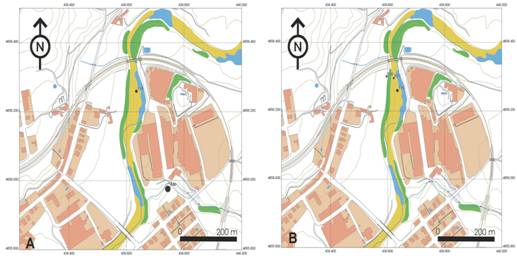
Fig 22: Maps of punctual concentrations (mg/l) of trans-1,2 DCE. A in November 2005, B in January 2006
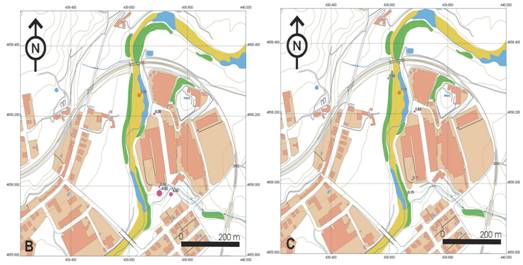
Fig 23: Maps of punctual concentrations (mg/l) of 1,1,1 TCA (red dots) and Chloroform (blue dots): A in November 2005 and B in January 2006.
It is interesting to note that in the sampling survey in January 2006, concentrations of these compounds within the town were observed (Figure 24). Despite the need for more data the presence of these contaminants could be associated with the hydraulic connection between the formation of fissured marls and the alluvial formation. If this hypothesis were certain, the fractured marl aquifer would be affected by the contamination.
Finally, the presence of vinyl chloride in the zone associated with area B (Figure 25) in January 2006 seems to confirm biodegradation
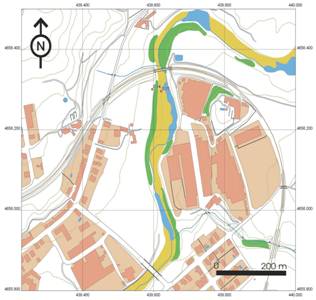
Fig 25: Map of punctual concentrations (mg/l) of VC in January 2006.
Monthly analytical monitoring of the contamination episode:
A monthly sampling of the contamination episode since 2002 has been carried out by analyzing the concentrations of PCE and TCE in the control points of the ACA.
As in the case of electrical conductivity, the comparative analysis between monthly surveys suggest that the concentrations of PCE in area B diminish when the water table increases. This dilution is related to the fact that the spill took place through a well. The spill occurred directly in the aquifer, which indicates that the residual fraction in the unsaturated zone was small.
By contrast, in the zone of area A, there are some points near the free phase where an increase in the PCE concentration takes place owing to a possible leaching due to water table washing of the residual fraction in the unsaturated zone. Another explanation for this increase could be a higher dissolution rate of the free phase.
The analysis of the evolution of the concentration of PCE and TCE at the control points suggests that the normalized concentrations of PCE (that oscillate between 1 and 0.2), does not experience a significant diminution from June 3 2002, when the monthly control of the concentrations begun after the implementation of the remediation measures (Figure 26, left side).
This observation suggests the existence of other mechanisms that permit the reincorporation of PCE, such as desorption and/or redissolution of volatilized plumes existing in the unsaturated zone.

Fig 26: Temporary evolution of the normalized concentrations of PCE and TCE and binary diagram in the control point SD18.
The same as PCE behavior in area A can be said with respect TCE, whose concentrations in area A maintain a direct relation with the PCE (Figure 26, right side).
By contrast, in the zone associated to the area B an increase in the normalized concentration of TCE is observed in some of the control points when the PCE concentrations diminish (Figure 27, left side). This suggests that hydrogenolysis degradation reactions of PCE to TCE by take place.
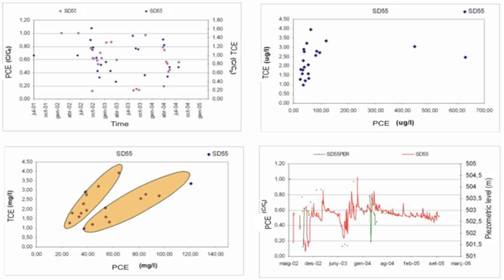
Fig 27: Temporary evolution of the normalized concentrations of PCE and TCE and binary diagrams at control point SD55.
In Figure 27 we can observe two families of points that adjust to straight lines. The family with the greater slope indicates that in it, for low PCE concentrations, there are greater concentrations of TCE than in the other family. This greater TCE is the
result of degradation of PCE, whereas the family with the smaller slope corresponds to the dissolution of the DNAPL free phase.
As regards this degradation process, one should recall the existence of some parameters and ions in solution that confirm the existence of average low oxidizing conditions which promote reactions of biodegradation of PCE an denitrification.
On the other hand, if the evolution of the water table is compared with the normalized concentration of PCE (Figure 27, right side lower part), the minimum values of water level correspond to the minimum of concentration and vice versa. This suggests that, in some cases, the remediation measures that currently are been carried out are not effective enough to eliminate contamination in the short term.
In other cases, as for example the remaining control points located in area A, very different behaviors can be displayed. Thus, point T17 (Figure 28) presents a general tendency of diminution of the normalized concentrations, with punctual increases, whereas point SD35 (Figure 29) has important oscillations of the normalized concentration.
In addition, in the binary diagram of Figure 29 of TCE versus PCE only one family of points is observed. This could mean that in this sector PCE degradation does not take place because environmental conditions are not favorable.
On the other hand, in the Torelló town (Figure 30 and 31), the existence of organic compound degradation produces a raised TCE concentration.
Moreover, in this zone a progressive diminution of the normalized concentration confirms that remediation methods are more efficient.
Finally, it is necessary to indicate that the PCE+TCE concentration is currently located below
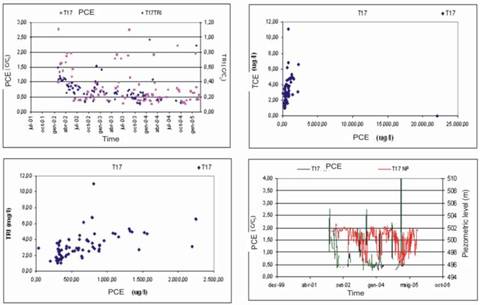
Fig 28: Temporary evolution of the normalized concentrations of PCE and TCE and binary diagrams in the control point T17. Zone A.
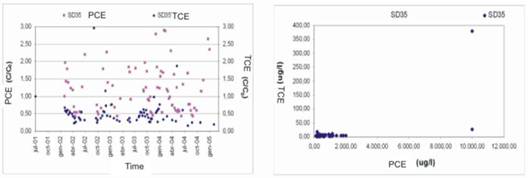
Fig 29: Temporary evolution of normalized concentrations of PCE and TCE and binary diagram in the pumping well SD35. Zone A.
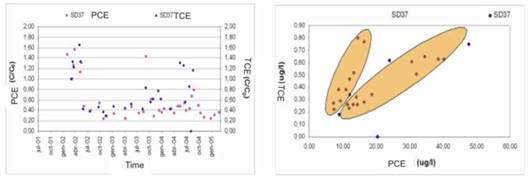
Fig 30: Temporary evolution of the normalization concentrations of PCE and TCE and binary diagram at the control point SD37. Municipal park zone.
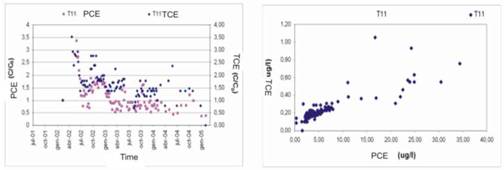
Figura 31: Temporary evolution of the normalized concentrations of PCE and TCE and binary diagram at the control point T11. Municipal park zone.
Acknowledgements:
My sincere gratitude goes out to ACA technical people, Tubkal consultant company the Torelló municipality and all of the private people who permitted to measure and took sample from their wells and they were contributed to do the study.


