Jianfeng Yang1, Guangxin Zhang2, Feng Yanfang1
1. Development Research Center, Chinese Geological Survey, Beijing 100083, China
2. Northeast Institute of Geography, Chinese Academy of Sciences, Changchun, Jilin province, China
Abstract: Saline and sodic soils have become an increasing acute problem in Songnen plain, northeast China. It is important to acquire a better understanding of groundwater’s role in soil salinization for ameliorating the saline-sodic soils. Soil water fluxes and variations of soil water content and soil salinity were investigated through local experiments in the field. An experimental facility was used to control a water table at the depths of 1.0 m, 1.4 m, 1.8 m, 2.2 m and 2.5 m in 10 independent soil columns during the experiment. Water fluxes at a water table deeper than 1.0 m were slight, and a slight amount of capillary rise from the water table occurred only after a long time dry period. Effective soil depth affected by rainfall and evapotranspiration was found not to exceed 40 cm, and the shallow groundwater had slight effect on soil water contents above the depth of 80 cm. Salt accumulation mainly occurred in the upper soil and past downward leaching of salts was not significant. There were no significant and regular differences in ECe, pH, Na+ contents, and SARe variations in the soil for the different depths of the water table. It is concluded that shallow groundwater has no obvious effect on variations of water and salt in the upper soil. Apparent electrical conductivity (ECa), soluble salt, and hydraulic properties at a field-scale site measuring 50m×100m were investigated and analyzed. At the experimental site, soil salinity, sodicity, and alkalinity are highly spatially variable, and high saline and sodic areas co-distribute with non- or low saline and sodic areas; the high spatial variability of soil salinity, sodicity, and alkalinity is closely associated with the microtopography, and high patches were accompanies by high salinity, high sodicity, and high alkalinity; the permeability of the upper soil is extremely low with saturated hydraulic conductivity less than 1 mm/d all over the experimental site. It implies that approaches of vertical leaching and lowering groundwater levels are not good options for ameliorating the saline and sodic soils.
Key words: shallow groundwater, salinization, soil water balance, soil salinity, local-scale, spatial variability, saline and sodic soil, saturated hydraulic conductivity
1 Introduction
Salt-affected soils occur mostly in regions of arid or semiarid climate, and have become an increasingly acute problem, which threatens the sustainable development of agriculture in these regions (Shirokova et al., 2000). One of main causes of the problem is the presence of a high groundwater table (U.S. Salinity Laboratory Staff, 1954; Tanji, 1990). So it triggered a variety of studies related to shallow groundwater and soil salinity (Hatmcher et al., 1996; Thibodeau et al., 1998; Salama et al., 1999).
It is estimated that saline and sodic soils occupy 3.27 million hectares, covering about 21% of total lands in Songnen plain, northeast China. Much work has been done to acquire a better understanding of groundwater’s role in soil salinazation in Songnen plain. Studies show that shallow groundwater plays a major role in the soil salinization, and water table depth is a key factor that determines the level of soil salinity on the whole (Chen, 1962; Cheng et al., 1963; Li et al., 1963; Yang et al., 1999; Song et al., 2000). Results of these studies concluded that saline-sodic soils usually did not occur with a water table depth greater than 3.5m, slightly saline-sodic soils usually occurred with a water table depth of 2.2~3.5m, moderately saline-sodic soils usually occurred with a water table depth of 1.7~2.2m, and highly saline-sodic soils usually occurred with a water table depth less than 1.7m.
However, a few recent studies seem to imply that the shallow groundwater is not a major contributor to the ongoing salinization in recent years. Liu et al. (2002) and Zhang (2004) found that regional groundwater level was declining on the whole from 1992 through 2001 at the west region of the Songnen plain. In 1992, groundwater table depths were less than 3.00m for the most parts of the region, while in 2001, groundwater table depths were greater than 3.35m. At the lower plain area (Anguang town to Shaoguo town), average groundwater table depth was 4.0~4.6m in 2001, 0.18~0.36m greater than in 1992. During the same period, the area of saline-sodic soils expanded rapidly and former saline-sodic soils were aggravated. Investigations by Zhou et al. (2003) show that in the region, the area of saline-sodic soils increased to 777,252 hm2 in 2000, 3.8% annually up from 675,531 hm2 in 1996. Superimposing the contour map of groundwater table depth upon the map of saline-sodic soils, Zhang (2000) found that saline-sodic soils could occur with a water table of 3.5~5.0 m.
Numerous efforts have been made to ameliorate the saline-sodic soils since late sixties of last century. These measurements include artificial drainage to lower the groundwater level, continuous ponding with rice growing, chemical application followed by frequent irrigations, growing salt-tolerant plants, sanding, etc. Ponding with rice growing seems the most successful method so far and is widely acknowledged by local governments and farmers. Obviously, these efforts did not prevent the salinization in Songnen plain.
Saline and sodic soils often display high spatial variability in soil salinity and sodicity on a field scale (Lesch et al., 1995; Pozdnyakova et al., 1999; Shirokova et al., 2000; Ardahanlioglu et al., 2003). It possibly caused by soil heterogeneity and temporal and spatial variations of external factors. These external factors may include: shallow groundwater, microtopography, seasonal waterlogging, and human activities. Therefore, investigating the spatial variability of soil salinity and sodicity helps to improve understandings of groundwater’s role in soil salinization, and explain further mechanism of soil salinization and alkalinization in the Songnen plain.
The objective of this study is to investigate saline-sodic soil water fluxes and variations of soil water content and soil salinity through local experiments, characterize spatial variability of soil salinity and sodicity, quantify the effect on soil hydraulic conductivity through field-scale experiments, and then analyze groundwater’s role in soil salinization with the aim to identify effective amelioration strategies for saline-sodic soils in the Songnen plain.
2 Materials and Methods
2.1 Experimental site
The study was conducted at Da’an Sodic Land Experimental Station located in Da’an, Jilin province, northeast China (latitude 45°35΄N, longitude 123° 50΄E). The area is part of the low plain region of the Songnen plain with an average slope of 1/5000~1/8000 toward the southeast, and in a semiarid zone with an average rainfall of 395.5 mm from 1956 through 2000. About 70% of the annual rainfall occurs during the rain seasons from June to August. Mean annual air temperature is 4.3ºC approximately, and annual pan evaporation amounts to 1780~1910mm. Frostless season lasts 140 days on the average.
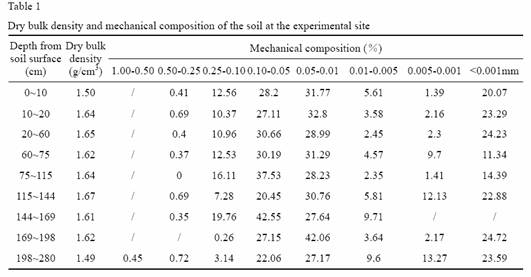
The experimental station occupies about 100 hm2, and is mainly covered by grassland and a little rain-fed cropland. Elevation within the station ranges from 131.31m to132.89m above mean sea level. The land surface is featureless and gently undulating, with rideaus randomly distributing. The soil is a loam, saline-sodic material that was developed in a fluvial bed. Dry bulk density and mechanical composition of the soil are listed in Table 1.
2.2 Local-scale experiments
2.2.1 Experimental facilities and Design
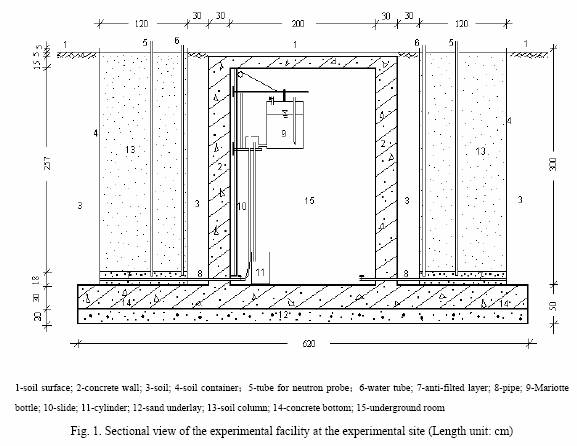
In order to control a groundwater table at different levels at the same time, an experimental facility was designed and constructed at the experimental site in June, 2003. A sectional view of the facility is shown in Fig. 1. The facility mainly consists of 10 independent soil columns measuring 1.2m×1.2m×2.95m and Marriott bottles that are used to control water tables in these soil columns. The soil was excavated from the field near the facility in 10 cm depth increments, then backfilled in layers approximately in its original conditions, and packed by saturating with water. The inverted filtering layer at the bottom is composed of fine sand. The soil surface was 5 cm from the top of soil steel containers. Measurement instruments installed in the soil columns include neutron probe access tubes, water-table tubes, soil water samplers (SKL 100). Depths of the soil water samplers are 30cm, 60cm, 100cm, and 150cm.
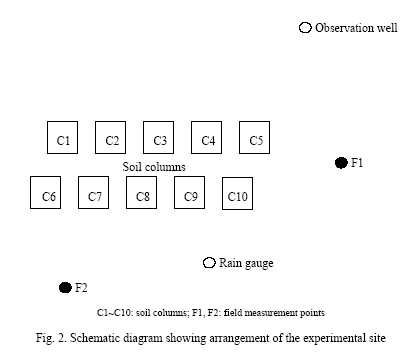
Fig. 2. shows arrangement of the experimental site. C1~C10 are the 10 independent soil columns, and F1, F2 are 2 field measurement points, both of which are 8 m from the facility. The water table depth in the field was observed through an observation well. The experiments were conducted under natural conditions during a frostless period from June 3 to October 15, 2004. The 10 soil columns were divided into 5 treatments and each treatment had 2 replicas. All soil columns were treated in the same way from June 3 to June 14. From June 15, water table depths for the 5 treatments started to be controlled at 1.0m (C1 and C6), 1.4m (C2 and C7), 1.8m (C3 and C8), 2.2m (C4 and C9), and 2.5m (C5 and C10) respectively. Measured water table depths for all treatments reached the expected values from June 25. During the period, grass at the experimental site was kept untouched.
2.1.2 Data measurement
Soil water content
Aluminium access tubes were installed to 2.9 m in all soil columns and field measurement points. Using a neutron probe, soil volumetric water content profiles were determined at a 5-day interval, and in 10 cm increments from 10 cm to 200 cm deep into the soil profiles. Apart from the regular measurements, soil volumetric water contents were also measured the day after each moderate or heavy rainfall.
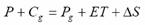
Soil water balance
Water balance of the unsaturated zone for the independent soil columns is expressed as:
 (1)
(1)
where P is precipitation (mm), ET is evapotranspiration (mm), ΔS is the net water storage (mm). Cg is the capillary upflow from the water table in the soil columns, while Pg is defined as the percolation to the water table. Cg and Pg cannot occur at the same time. Daily P was measured with a rain gauge installed at the experiment site (Fig. 2). Daily Cg and Pg were measured with the water-table controlling device—Mariott bottles (Fig. 1). 5-day ΔS was derived from soil volumetric water content variations. Therefore, 5-day ET was calculated as follows:
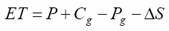 (2)
(2)
There were 2 replicas for each treatment of the 10 soil columns, in which a water table was kept at a given level during the period from June 25 to October 15, 2004. Therefore, each component of the soil water balance for each given DWT (depth of the water table) was calculated as the mean value of the 2 replicas of the treatment with the DWT.
Soil solution and groundwater sampling and analysis
With soil water samplers (SKL100), soil solution sampling was done from the C1~C5 soil columns during the experiment. Sampling was done at 30 cm, 60 cm, 100 cm and 150 cmdepths every month (on 12th) from July to October, 2004. Groundwater sampling was done from the observation well simultaneously. Laboratory analysis included determinations of pH, electrical conductivity (ECe), and concentrations of major ions including Na+, K+, Ca2+, Mg2+, CO32-, HCO3-, and Cl-. When the soil was dry, no or too little soil solution was able to be extracted. At these cases, cations were analyzed primarily. Sodium adsorption ratio (SARe) was calculated by the following equation using concentrations of the cations Na+, Ca2+, and Mg2+ in mmol/l:
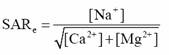 (3)
(3)
Soil sampling and analysis
Soil sampling was done at the measurement point F1 on July 17 and October 17. Samples were collected at 10cm intervals to a depth of 20cm, and then at 20cm intervals to a depth of 200cm. All soil samples were air-dried and then passed a 1-mm round-hole sieve for chemical analyses. Soluble salt estimates were based on soil:water 1:5 extracts. The pH1:5 and EC1:5 of the extracts were determined using a pH meter and a conductivity meter respectively. The concentration of Na+, K+, Ca2+, and Mg2+ were determined by atomic absorption spectrometry (GBC-906AAS). The concentration of CO32- and HCO3- were determined by neutral titration method. The concentration of Cl- were determined by silver nitrate titration method, and the concentration of SO42- were determined by barium sulfate turbidimetric method.
Water level monitoring
A water level gauge was used to measure water levels in the observation well everyday from May 21 to October 18. Water levels in the soil columns were also measured everyday in order to examine whether the water tables were controlled at their expected levels.
2.3 Field-scale experiments
The experimental site was described in Yang et al., 2005. In short, the study was conducted at Da’an Sodic Land Experimental Station located in Da’an, Jilin province, northeast China. The area is part of the low plain region of the Songnen plain with an average rainfall of 395.5 mm. The land surface is featureless and gently undulating, with small rideaus and dishes alternately distributing. The soil is a loam, saline-sodic material that was developed in a fluvial bed.
An area measuring 50m×100m was selected within the experimental station. The area is characterized by its saline and sodic soils. A ridge was constructed along the boundary of the area in case surface runoff entered the area after rainfall events. The ridge was 40 cm high and 40 cm wide. The area was divided into 1m×1m grid squares, and 20 grids was selected randomly as measurement points (Fig. 3). The land surface in the area is gently undulating, with the maximal difference less than 10 cm in elevation. The highest patch in the area located in the bottom right corner where the measurement points No.2, No.3 No.4 were in Fig. 1. The patches, where the measurement points No.1, No. 5, and No.6 were and where the measurement point No. 13 was, were a little lower than other parts in the area in elevation.
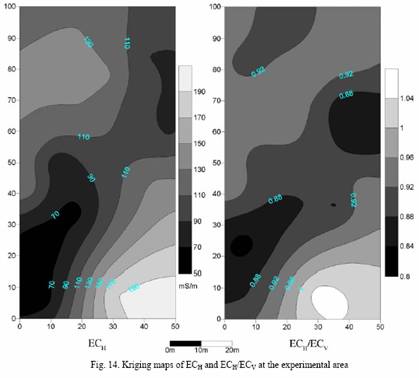
ECa (apparent electrical conductivity) measurement was made at the 20 measurement points every month from July to October using the Geonics EM-38 electrical conductivity meter. At each measurement point, ECa measurements were taken with the EM-38 in the vertical dipole mode (ECV) and in the horizontal dipole mode (ECH). ECH measurements in the horizontal dipole mode reflect primarily the electrical conductivity nearer to the soil surface and penetrate to a depth of about 1 m, and ECV measurements in the vertical dipole mode reflect primarily the electrical conductivity of the soil at the depth of about 40cm and penetrate to a depth of 1.5 m. From the measurements, the mean of ECH and ECV over time and then the ratio of ECH/ECV were calculated for each measurement point. The means of ECH were used to characterize the spatial variability of soil electrical conductivity over the area. The ratios of ECH/ECV were used to characterize the variability of soil electrical conductivity in soil profiles.
Soil samples were done at the depth of 0~10 cm at the 20 measurement points on July 17 and October 17, 2004 for laboratory analysis including pH, EC, Na+, K+, Ca2+, Mg2+, CO32-, HCO3-, Cl-, SO42-. All soil samples were air-dried and then passed a 1-mm round-hole sieve for chemical analyses. Soluble salt estimates were based on soil:water 1:5 extracts. The pH1:5 and EC1:5 of the extracts were determined using a pH meter and a conductivity meter respectively. The concentration of Na+, K+, Ca2+, and Mg2+ were 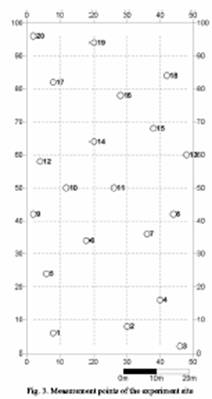
determined by atomic absorption spectrometry (GBC-906AAS). The concentration of CO32- and HCO3- were determined by neutral titration method. The concentration of Cl- were determined by silver nitrate titration method, and the concentration of SO42- were determined by barium sulfate turbidimetric method. Sodium adsorption ratio (SAR1:5) was calculated by the following equation using concentrations of the cations Na+, Ca2+, and Mg2+ in mmol/l:
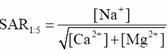 (1)
(1)
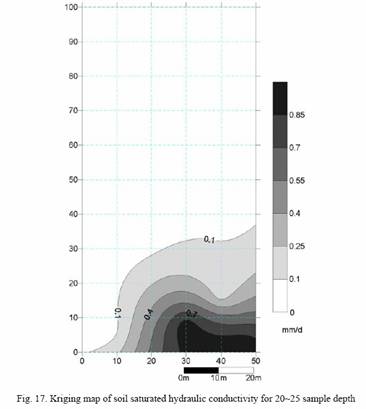
Soil saturated hydraulic conductivity (Ks) at the depths of 20~25 cm for each measurement point was measured by the falling head method. A cutting ring of 5 cm diameter was used to get an undisturbed soil core in situ. Then the soil core with the ring was placed into a permeameter. Two fine stainless steel meshes were glued respectively to the base and the top to prevent loss of soil. The soil cores were slowly saturated by standing them in tap water. Since the Ks values of these undisturbed cores were very small, a total water pressure of 0.5~1.6 m was applied at the inflow end of the soil samples. For each measurement point, 3 soil samples were measured and the final Ks value was the mean of the three measured Ks values.
Kriging maps of soil salinity, sodicity, and soil saturated hydraulic conductivity over the area were developed using Golden Software Surfer 7.0.
3 Results and Discussion
3.1 Local experiments
3.1.1 Soil water balance in the soil columns
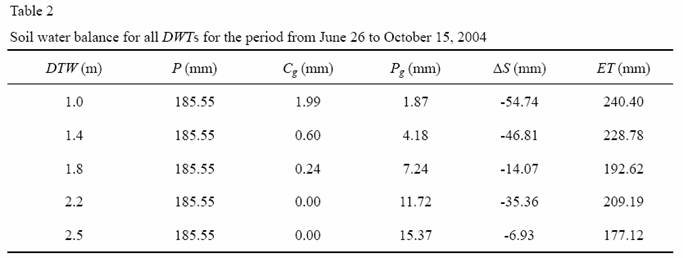
The components of the soil water balance for all depths of water table (DWTs) for the period from June 26 to October 15, 2004, are presented in Table 2. The data show thatP and ET were two dominant components of the soil water balance for all DWTs. ET was greater than P for the DWTs of 1.0m, 1.4m, 1.8m, and 2.2m. A slight amount of capillary rise from the water table (Cg) occurred only for the DWTs of 1.0m, 1.4m, and 1.8m, and Cg decreased sharply as DWT increased. There was no capillary rise for the DWTs of 2.2mand 2.5m. A small amount of percolation to the water table (Pg) occurred for all DWTs. Pg was up from 1.87 mm to 15.37 mm as DWT increased from 1.0 m to 2.5 m. The negative values of ΔS for all DWTs indicated that stored soil water was depleted by 6.93~54.74 mm mainly due to evapotranspiration. Therefore, it can be concluded that
water fluxes at the water table were slight during the experiment.
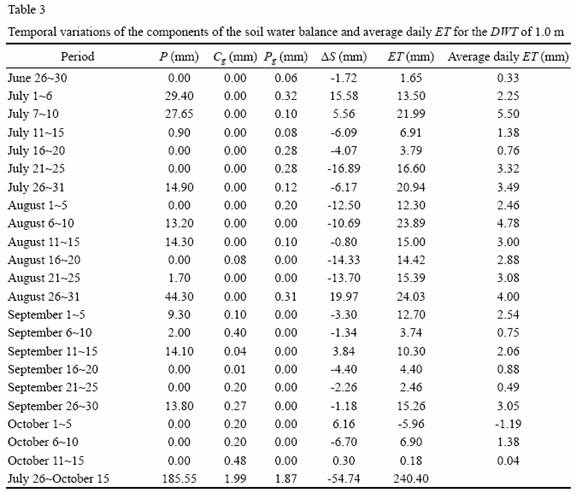
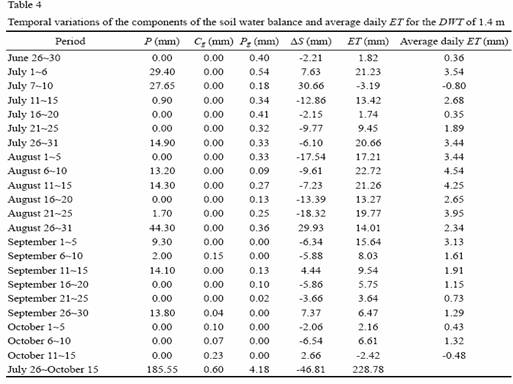
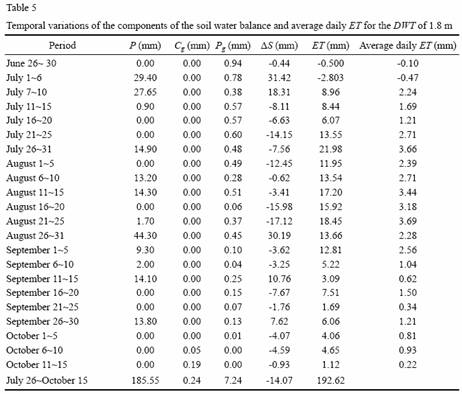
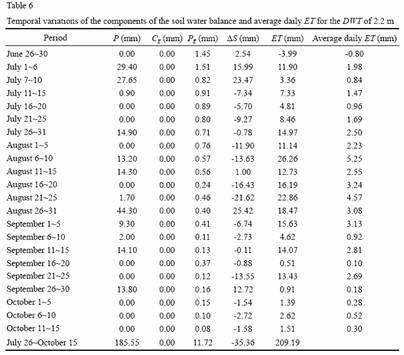
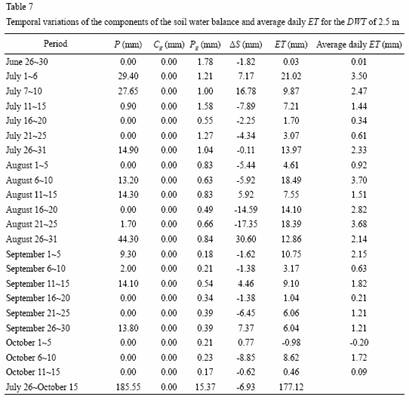
Table 3~7 show temporal variations of the components of the soil water balance and average daily evapotranspiration for the DWTs of 1.0 m, 1.4 m, 1.8 m, 2.2 m, and 2.5 mfor the period from June 26 to October 15, 2004. Pg decreased gradually as time went on, and at the later stage Pg decreased to zero and a slight amount of Cg appeared for theDWTs of 1.0 m, 1.4 m, and 1.8 m. The data show that ΔS and average daily ET fluctuated similarly over time: soil water storage increased and average daily ET rose subsequently after rainfall events; soil water storage decreased slowly and average daily ET dropped as well at intervals between two consecutive rainfall events. Average daily ET usually was greater than 2.0 mm immediately after rainfall events, and was less than 2.0 mm during long inter-rain intervals.

3.1.2 Variations of soil water content in the soil columns
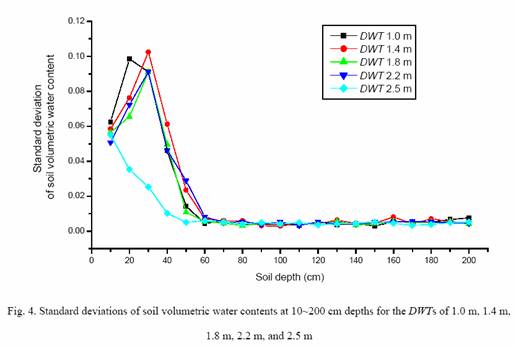
Measured soil volumetric water contents at each soil depth from June 16 to October 15 constitute a sample, and the standard deviation of the sample reflects the intensity of temporal variations in the soil volumetric water contents. Fig. 4 shows standard deviations of soil volumetric water contents at 10~200 cm depths for the DWTs of 1.0 m, 1.4 m,1.8 m, 2.2 m, and 2.5 m. At soil depths greater than 60 cm, the standard deviations of soil volumetric water contents are very small (<0.008). It means that soil volumetric water contents below the soil depth of 60 cm remained nearly unchanged during the period, and the effective soil depths affected by rainfall and evapotranspiration were less than 60 cm.
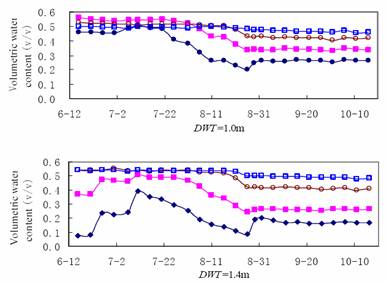
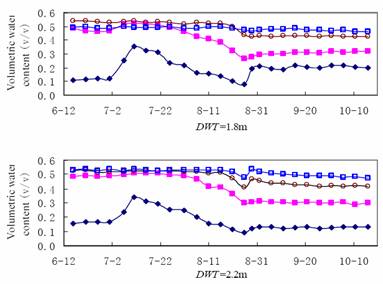
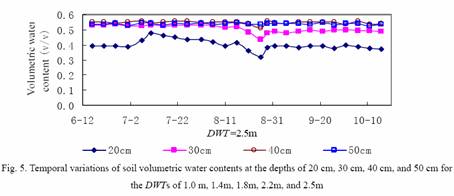
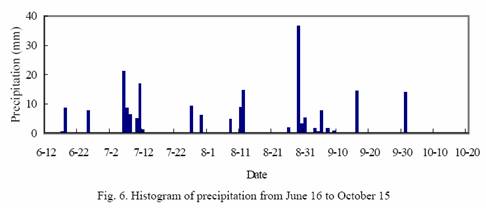
Spatial patterns of soil volumetric water contents above the soil depth of 60 cm are shown in Fig. 5. For the DWTs of 1.0 m, 1.4 m, 1.8 m, 2.2 m, 2.5 m, the variations of soil volumetric water contents bore some same characteristics: soil volumetric water contents decreased on the whole through the period, and average soil volumetric water contents at late stages were less than at early stages; soil volumetric water contents at different depths had similar fluctuations in time, but the deeper into the soil, the more subdued the fluctuations were. Compared the variations of soil volumetric water contents with the variations of rainfall (Fig. 6), it is obviously that soil water contents rose after each rainfall event and decreased slowly during inter-rain intervals. The variations of soil volumetric water contents at different depths indicated that the shallower into the soil, the more sensitive the soil water contents were to rainfalls; on the contrary, the deeper into the soil, the less noticeably the soil water contents varied.
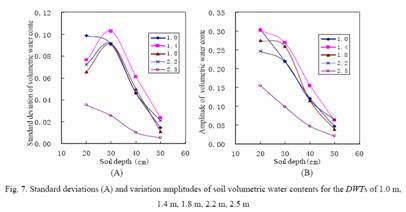
Comparisons of standard deviations and variation amplitudes of soil volumetric water contents at the depths of 0~60cm for the DWTs of 1.0 m, 1.4 m, 1.8 m, 2.2 m, and 2.5 m(Fig. 7 (A) (B)), show that there were no regular discrepancies between different DWTs. Similarly, there were no regular discrepancies as well in the average volumetric water contents of 0~60 cm deep soil between different DWTs. It implies that the shallow groundwater had no noticeable effect on the volumetric water contents of 0~60 cm soil with a water table of 1.0~2.5m. Therefore, driving forces for water content changing in 0~60 cm deep soils were principally the alternative occurrences of short-time rainfall and long-time evapotranspiration.
3.1.3 Variations of water table depth and soil water content in the field
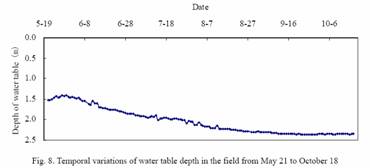
Fig. 8 shows temporal variations of water table depth in the field from May 21 to October 18. During the period, the minimal DWT was 1.40 m, occurring on May 28; the maximal DWT was 2.37 m, occurring on September 29. The groundwater level declined on the whole and fluctuated gently. The maximal declining amplitude reached 0.97 m. The slight fluctuations of DWT in the field mean that rainfall events had slight impact on the groundwater level. The slow declining of the groundwater level was possibly caused by regional groundwater flow.
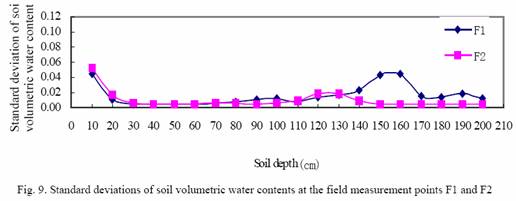
Variations of standard deviations of soil volumetric water contents at the measurement points F1 and F2 (Fig. 9) indicate that the soil water contents above the depth of 40 cm and below the depth of 80 cm varied remarkably over time; standard deviations were very small (<0.007) at the depths of 40~80 cm, and the soil water contents seemed to remain unchanged with time.
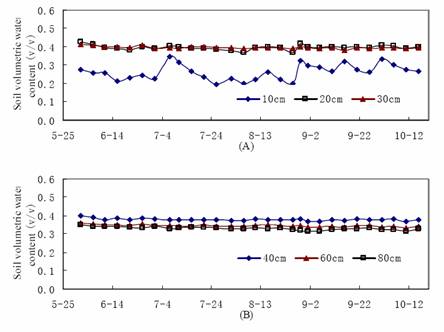
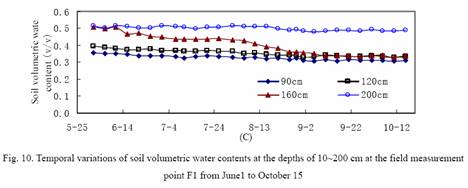
Fig. 10 (A)(B)(C) show respectively temporal patterns of soil volumetric water contents above the depth of 40 cm, at the depths of 40~80 cm, and below the depth of 80 cm at the field measurement point F1 from June 1 to October 15. The soil water contents above the depth of 40 cm, especially 10 cm, varied continually with time: rising abruptly after rainfall events and decreasing slowly during inter-rain intervals. The soil water contents went through a cyclical pattern similar to precipitation. The deeper into the soil, the less noticeably the soil water contents varied. The soil water contents at the depths of 40~80 cm hardly changed and remained at some level approximately. The soil water contents below the depth of 80 cm, especially at the depth of 160 cm, decreased on the whole with time. From the characteristics of the soil water content variations, we estimate that the variations of the soil water contents above the depth of 40 cm were mainly due to rainfall and evapotranspiration; the variations of the soil water contents below the depth of 80 cm were mainly due to fluctuations of the water table; the soil water contents at the depth of 40~80 cm remained unchanged approximately and were hardly affected by external processes.
Temporal variations of soil water content can reflect soil physical properties to some extent. The above-mentioned analysis show that the soil water contents at the depths of 40~80 cm were hardly affected by rainfall, evapotranspiration, and groundwater fluctuations, and the soil water contents at the depths of 20~40 cm were not very sensitive to rainfall and evapotranspiration. The analysis confirms that saline-sodic soils have poor physical properties: slow internal drainage and low permeability (Keren 2003).
Compared the variations of soil water contents in the soil columns with those in the field, it was clear that the effective depth affected by rainfall and evapotranspiration in the soil columns was greater than that in the field. The reason for that was that although the soil in the soil columns was backfilled layer by layer approximately in its original conditions, it was artificially disturbed and its dry bulk density and compaction degree were bound to be less than the soil in the field. It can be predicted that temporal patterns of soil water content in the soil columns will be close to those in the field after several years.
Therefore, it can be concluded that at the experimental site, the effective soil depth affected by rainfall and evaporation did not exceed 40 cm, and the shallow groundwater with a water table greater than 1.0 m had slight effect on soil water contents above the depth of 80 cm.
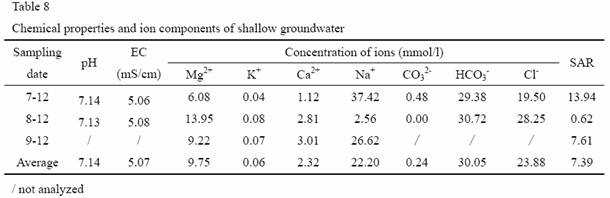
3.1.4 Salinity and sodicity of shallow groundwater in the field
For the shallow groundwater, its pH was slightly greater than 7.0, its EC was higher than 5.0 mS/cm (Table 8), and therefore the groundwater was a moderately saline, neutral solution. Its major cations included Na+, Mg2+, and Ca2+, and their average mol percent were 21.5%, 12.1%, and 2.4% respectively. Its major anions include HCO3- and Cl-, and their average mol percent were 35.2% and 28.4%. The concentration of ions varied greatly over time. For example, the concentration of Na+ was 37.42 mmol/l on July 12, and then decreased sharply to 2.56 mmol/l on August 12. The same went for SAR. Therefore, the ions content of the groundwater varied frequently and greatly, and the variations was possibly caused by groundwater flow.
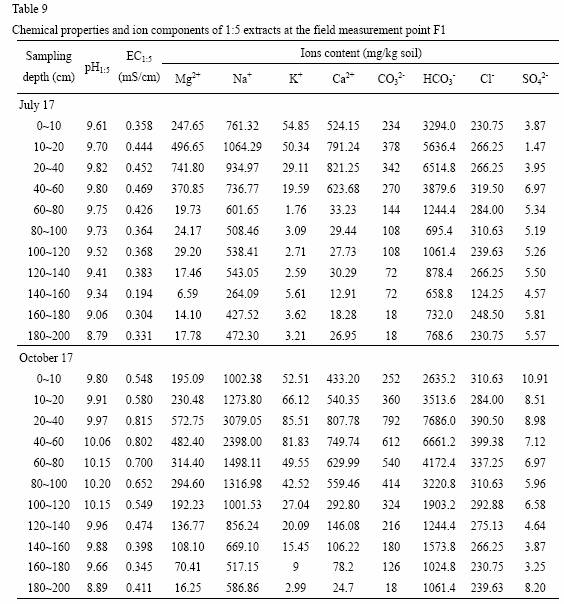
3.1.5 Soil salinity and sodicity in the field
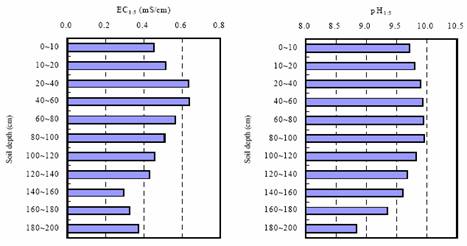
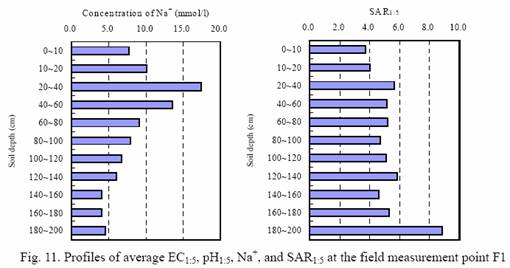
Table 9 lists the chemical properties and ion components of 1:5 extracts at the field measurement point F1. Fig. 11 shows the profiles of average EC1:5, pH1:5, Na+, and SAR1:5 at the field measurement point F1. EC1:5 was higher at the depths of 20~80 cm than at other depths, and decreased downward gradually. pH1:5 was larger than 8.5 at all depths, and was close to 10.0 at the depths of 20~100 cm, then decreased rapidly below the depth of 160cm. The concentration of Na+ was the highest at the depths of 20~40 cm, and declined downward. SAR1:5 was obviously lower at the depths of 0~20 cm than at other depths, ranged from 4.6 to 5.8 at the depths of 20~180cm, and rose abruptly below the depth of 180 cm. The results imply that salt accumulation mainly occurred in the upper soil and past downward leaching of salts was not significant at the experiment site.
3.1.6 Salinity and sodicity of soil water in the soil columns
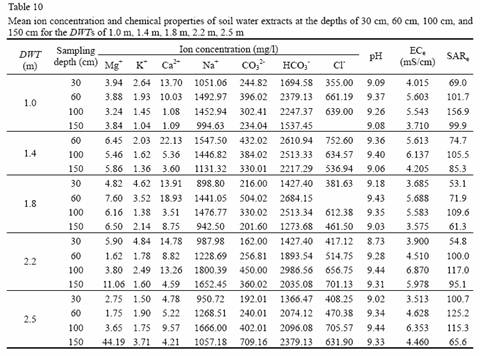
From Table 10, it was clear for all soil water extracts that: (1) pH values were larger than 8.5, and the extracts were alkaline solutions; (2) ECe ranged 3.51~6.87 mS/cm, equivalent to the shallow groundwater; (3) Na+ and HCO3- were predominant ions in the solutions, and their mol percents were 46.2~59.6% and 25.3~38.0% respectively; (4) Ca2+ and Mg2+ contents were very low, and their mol percents were lower than 0.5%; (5) SARe varied from 53.1 to 156.9, greatly higher than the shallow groundwater.
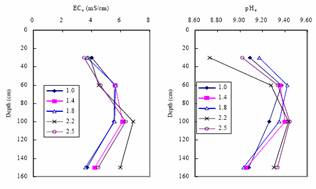
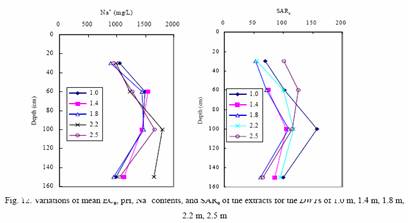
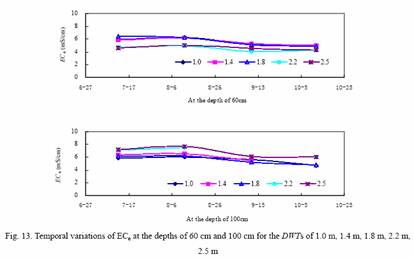
For all DWTs, ECe, pH, Na+ contents, and SARe of the extracts varied with the sampling depth. Fig. 12 shows that ECe, pH, Na+ contents, and SARe were higher at the depths of60 cm and 100 cm that at the depths of 30 cm and 150 cm. Fig. 13 indicates that the temporal variations of ECe of the extracts were not significant, and ECe for all DWTs fluctuated in a similar pattern. For all DWTs, there were no significant and regular differences in the ECe, pH, Na+ contents, and SARe variations. It implied that the effect of the shallow groundwater on the chemical properties of soil water was not obvious.
3.2 Field-scale experiments
3.2.1 Soil salinity
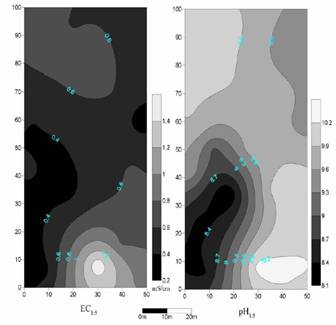
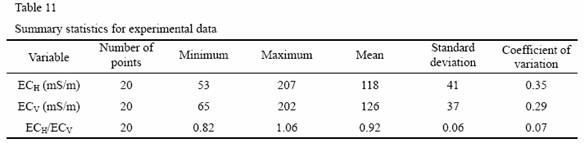
ECa measurements provide a rapid and low-cost way of characterizing the spatial variability of soil salinity. Table 11 lists the descriptive statistics of the ECH, ECV, and ECH/ECV data at the 20 measurement points, including minimum, maximum, mean, standard deviation, and coefficient of variation. The descriptive statistics suggest that both ECHand ECV are highly spatially variable, and the variation of ECH is similar to that of ECV. The spatial variations of ECH and ECH/ECV are shown in Fig. 14.
The variation of ECH in Fig. 14 indicated high spatial dependence. When related the variation to the microtopography, it is clear that the highest ECH occurred where the soil surface is the highest in the experimental area, and slight differences in soil surface elevation resulted in high variability in soil salinity. The chances and time of waterlogging at the lower patches after moderate and heavy rain events are bound to be more than at the higher patches, so the occurrence of soil salinization was associated with microtopography and waterlogging to a degree.
For the ratios of ECH to ECV, its mean was 0.92 and its standard deviation was 0.06. It means that although ECH was a little lower than ECV for the most parts, their differences were not significant. Therefore, at the most parts in the experimental area, the electrical conductivity of the upper soil was slightly lower than that of the subsoil. Comparisons of the krighing map of ECH with ECH/ECV (Fig. 2) show that the parts where ECH/ECV was greater than 1.0 happened to be where ECH was greater than 130 mS/m. Obviously, salt content in the upper soil was more than in the subsoil for the highly saline soils. However, ECH/ECV<1.0 does not necessarily mean that salt content in the subsoil was more than in the upper soil. It is because ECa measured by EM-38 is directly correlated to soil water content (Sheets et al., 1995) and soil water content in the subsoil is usually greater than that in the upper soil.
3.2 Soluble salt and chemical properties
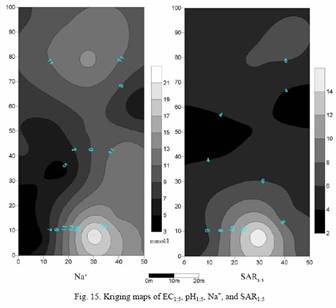
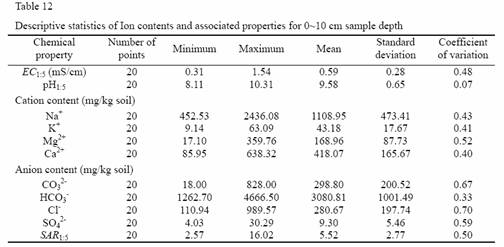
The descriptive statistics of ion contents and associated properties for 0~10 cm sample depth at the 20 measurement points were listed in Table 12. The content of Na+ was far higher than other cations with a mean of 1108.95 mg/kg, and the content of HCO3- was far higher than other anions with a mean of 3080.81 mg/kg. The mean pH value of the 1:5 extracts was 9.58, so the extracts were alkaline or strongly alkaline. As soil ECH, the soluble salt and its chemical properties displayed high spatial variability in the experimental area. The spatial distributions of EC1:5, pH1:5, Na+, and SAR1:5 were very similar to those of ECH (Fig.15). High salinity patches irregularly elliptically distributed and were interfaced with relatively low salinity parts on the soil surface. Where the soil salinity was high, where the sodicity and the alkalinity were high as well. In other words, for the saline and sodic soils, high salinity was subsequently companied by high sodicity and high alkalinity. The coexistence of salinity, sodicity, and alkalinity at one location suggests that the processes of soil salinization and soil sodification and alkalinization occurred at the same time at the same location. The soil salinity, sodicity, and alkalinity were intimately dependent on the microtopography. The high patches were mostly associated with high salinity, high sodicity, and high alkalinity; the relatively low patches were mostly associated with low salinity, low sodicity, and low alkalinity.
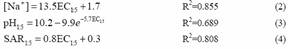
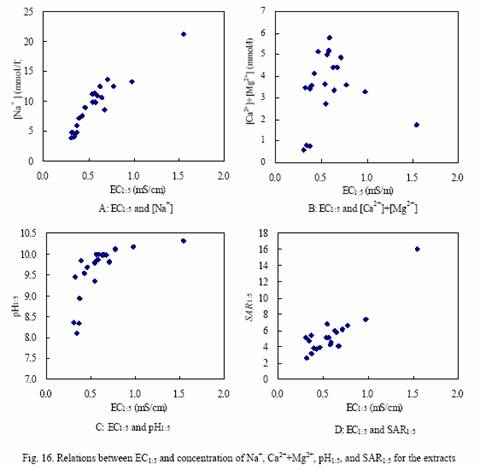
It is more convenient and less expensive to determine EC1:5 than to determine other chemical properties for the extracts of the saline and sodic soils. If the relations between EC1:5 and other chemical properties are known, then EC1:5 can be used to estimate other chemical properties of the extracts. The relations are also useful in ameliorating saline and sodic soils. Fig. 16 shows that EC1:5 was directly correlated to the concentration of Na+, pH1:5, and SAR1:5, and was inversely correlated to the concentration of Ca2+and Mg2+. Therefore, with soil salinity increasing, pH value, Na+ content, and SAR rise, and Ca2+ and Mg2+ content declines. High soil salinity is companied by high sodicity and high alkalinity.
The statistical relations between EC1:5 and the concentration of Na+, pH1:5, and SAR1:5 are derived from the above-mentioned analysis data as follows:
3.3 Soil saturated hydraulic conductivity
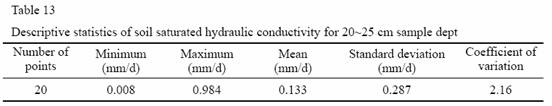
To determine soil saturated hydraulic conductivity (Ks) was very time-consuming in laboratory. It took more than 15 days for most soil samples to finish the measurements with a water-head difference greater than 0.5 m. The descriptive statistics of Ks for 20~25 cm sample depth at the 20 measurement points are listed in Table 13. Of all measurement points, only Ks at No. 2, 3, and 4 was greater than 0.1 mm/d. The maximal Ks was 0.984 mm/d, which occurred at the point No. 3; the minimal Ks was 0.008 mm/d, which occurred at the point No. 9. The mean of Ks was only 0.133 mm/d. The results are very close to those of the sodic soils at Indus basin in Pakistan, measured by Akhter (2002). Therefore, the permeability of the saline and sodic soil in the experimental area was very poor, or it can be considered that the upper soil was an impermeable layer to a great extent.
The soil saturated hydraulic conductivity also displayed high spatial variability (Fig. 17). Compared Fig. 17 with Fig. 14, it is obviously that at the locations where ECHwas high, Ks was high either. The area where ECH was less than 130 mS/m coincided approximately with where Ks was less than 0.1 mm/d. The soils containing more salt were more permeable than those containing less salt. Therefore, the soil saturated hydraulic conductivity was directly correlated to the soil salinity for the saline and sodic soil.
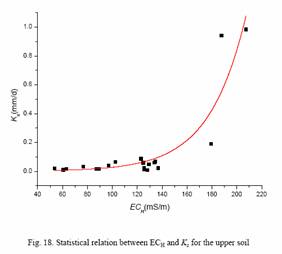
Using statistical method, a relation between ECH and Ks was derived from the measured ECH and Ks values as follows (Fig. 18):

If ECH is less than 130 mS/m, Ks rises slightly with ECH increasing; if ECH varies from 130 mS/m to 170 mS/m, Ks rises rapidly with ECH increasing; if ECH is greater than 170 mS/m, Ks rises sharply with ECH increasing.
From the above-mentioned analysis, it is inferred that soil permeability at high patches was better than that at relatively lower patches in the experimental area. Soil aggregates are reliable to disperse and slake in the case of low salinity, high SAR, and high pH (Tanji, 1990; Keren, 2003). At the high patches, although both SAR and pH were high, high salt content alleviated the degree
of dispersing and slaking of soil aggregates and resulted in slightly better permeability.
4 Conclusions
At the experimental site, water fluxes at a water table deeper than 1.0 m were slight, and a slight amount of capillary rise from the water table occurred only after a long time dry period. Effective soil depth affected by rainfall and evapotranspiration was found not to exceed 40 cm, and the shallow groundwater had slight effect on soil water contents above the depth of 80 cm. Salt accumulation mainly occurred in the upper soil and past downward leaching of salts was not significant. There were no significant and regular differences in ECe, pH, Na+ contents, and SARe variations in the soil for different depths of the water table. Therefore, it is considered that shallow groundwater has no obvious effect on variations of water and salts in the upper soil.
Field-scale soil salinity, sodicity, and alkalinity are highly spatially dependent. The high spatial variability of soil salinity, sodicity, and alkalinity is closely associated with the microtopography. The permeability of the upper soil is extremely low with saturated hydraulic conductivity less than 1 mm/d all over the experimental site. The results of the field-scale experiments and the local-scale experiments suggest that the shallow groundwater has slightly effect on the variations of water and salt in the upper soil and was not a main cause of the ongoing secondary soil salinization.
Due to the existence of an extremely hard layer in the upper soil, approaches of vertical leaching are not effective for ameliorating the saline and sodic soils. Lowering groundwater levels is not a good option when reclaiming the soils. As the study made by Qadir et al. (1998), horizontal flushing is a promising ameliorative technology for the saline and sodic soils in the Songnen plain.
Acknowledgement
This study was supported by the knowledge innovation project of the Chinese Academy of Sciences (KZCX1-SW-19-2). We also wish to acknowledge the support of Da’an Sodic Land Experimental Station.
References
[1] Akhter, J., Ahmed, S., and Malik, K. A. Use of brackish water for agriculture: Growth of salt tolerant plants and their effects on soil properties. Science Vision, 2002, 7: 230-241.
[2] Ardahanlioglu, O., Oztas, T., Evren, S., Yilmaz, H., Yildirim, Z. N., 2003. Spatial variability of exchangeable sodium, electrical conductivity, soil pH and boron content in salt- and sodium-affected areas of the Igdir plain (Turkey). Journal of Arid Environments, 54, 495-503
[3] Chen, E., 1962. Origin and accumulation of salinity and sodicity in Qianguo irrigated area, Jilin province. Acta Pedologica Sinica. 10(2), 201-214 (in Chinese)
[4] Cheng, B., Wang, R., Ma, Q., and Luo, X., 1963. Salt accumulation of saline-sodic soils in Songnen plain, northeast China. Acta Pedologica Sinica .11(1), 19-24 (in Chinese, English abstract)
[5] Hutmacher, R. B., Ayars, J. E., Vail, S. S., Bravo, A. D., Dettinger, D., Schoneman, R. A., 1996. Uptake of shallow groundwater by cotton: growth stage, groundwater salinity effects in column lysimeters. Agricultural Water Management. 31: 205-223
[6] Keren, R., 2003. Soil alkalinization. In Handbook of process and modeling in the soil-plant system, eds. D. K. Benbi and R. Nieder. Food Products Press and the Haworth Reference Press, pp199-221
[7] Lesch, S. M., Strauss, D. J., Rhoades, J. D., 1995. Spatial prediction of soil salinity using electromagnetic induction techniques: 1. Statistical prediction models: A comparison of multiple linear regression and cokriging. Water Resources Research, 31: 373–386
[8] Li, C., and He, W., 1963. Types, properties and formation of saline-sodic soils in Songnen plain. Acta Pedologica Sinica. 11(2), 196-208 (in Chinese)
[9] Liu, X., He, Y., Deng, W., Song, Y., Wu., Z., 2002. Comprehensive development of regional agriculture in northeast China. Science Press. Beijing. (in Chinese)
[10] Pozdnyakova, L., Zhang, R., 1999. Geostatistical analyses of soil salinity in a large field. Precision Agriculture, 1, 153-165.
[11] Qadir, M., Qureshi, R. H., Ahmad, N., 1998. Horizontal flushing: a promising ameliorative technology for hard saline-sodic and sodic soils. Soil & Tillage Research, 45, 119-331
[12] Salama, R. B., Otto, C. J., Fitzpatrick, R. W., 1999. Contributions of groundwater conditions to soil and water salinization. Hydrogeology Journal. 7, 46-64
[13] Sheets, K. R., and Hendrickx, J. M. H., 1995. Noninvasive soil water content measurement using electromagnetic induction. Water Resources Research, 31, 2401-2409.
[14] Shirokova, Y., Forkutsa, I., Sharafutdinova, N., 2000. Use of electrical conductivity instead of soluble salts for soil salinity monitoring in Central Asia. Irrigation and Drainage Systems. 14, 199-205
[15] Song, C., and Deng, W., 2000. Characters of Groundwater and Influence on the interior salt-affected soil in the west of Jilin province. Scientia Geographica Sinica. 20(3), 246-250 (in Chinese, English abstract)
[16] Tanji, K. K., 1990. Agricultural salinity assessment and management. ASCE Manuals and Reports on Engineering Practice No. 71. American Society of Civil Engineering. New York, N.Y., USA.
[17] Thibodeau, P. M., Gardner, L. R., and Reeve, H. W., 1998. The role of groundwater flow in controlling the spatial distribution of soil salinity and rooted macrophytes in the southeastern salt marsh, USA. Mangroves and Salt Marshes. 2, 1-13
[18] U.S. Salinity Laboratory Staff, 1954. Diagnosis and improvement of saline and alkali soils. USDA Agriculture Handbook No. 60. U. S. Government Printing Office, Washington25, D. C.
[19] Yang, J., and Luo, X., 1999. Relation between soil salinization and underground water dynamics. Bulletin of Soil and Water Conservation. 19(6), 11-15 (in Chinese, English abstract)
[20] Zhang, D., 2000. GIS-based investigations of land salinization in the west plain of Jilin province. Dissertation of Changchun University of Science and Technology. (in Chinese, English abstract)
[21] Zhang, G., 2004. Study on the evolution of groundwater environment and safety management in the Taoer River Basin. Dissertation of the graduate school, Chinese Academy of Sciences. (in Chinese, English abstract)
[22] Zhou, Y., Fu, Z., Liu, D., Wang, L., and Wang, L., 2003. A study on the processes of grassland degradation, land salinization and soil desertification in the west of Jilinprovince. Journal of Jilin University (Earth Science Edition). 33(3), 348-354 (in Chinese, English abstract)