


Achievements
CALCULATING BASEFLOW AND ANALYZING CLIMATE FACTORS IMPACT ON IT IN THE SOURCE REGIONS OF THE YELLOW RIVER
Liqun Chen 1,4, Changming Liu 1,2, Fanghua Hao 3
(1
2 college of water
science, Beijing Normal
University, Beijing
100875,
3 School of
Environment, Beijing Normal University,
Beijing 100875,
4 Graduate school of Chinese Academy
of sciences, Beijing 100039,
Abstract: The purpose of this study is to identify and assess the change of
baseflow and impacts of climate factors on it in the source regions of the
Yellow River, based on analyses of long hydrological time series (1956-2000)
from four subbasins of the source regions of the Yellow River and the whole
source regions of the Yellow River.
Key words: Yellow River, baseflow, precipitation, temperature
Introduction
The characteristics of many terrestrial ecosystems, for example, are heavily influenced by water availability and, in the case of instream ecosystems and wetlands, by the quantity and quality of water in rivers and aquifers (McCarthy et al., 2001). Consequently, there have been a great many studies on changes in the regional hydrological cycle (Thomas, 2000; Burn and Elnur, 2002) and the potential effects of climate change on hydrology (focusing on cycling of water) and water resources (focusing on human and environmental use of water).Baseflow is an important genetic component of streamflow, which comes from groundwater storage or other delayed sources (shallow subsurface storage, lakes, melting glaciers, etc.) (Smakhtin, 2001). Discharge in most rivers is strongly dominated by outflow from a shallow groundwater reservoir exfiltrating through the banks and the bottom not only in rainless periods but also during rainstorm events. Information on baseflow characteristics provides threshold values for different water-based activities and is required for such water resource management issues as water supply, irrigation, and water quality and quantity estimates.
The
Yellow River, originating from the Yueguzonglie basin on the northern part of
the Bayankela Mountain in Tibet highlands at el. 4,500 m is flowing through nine provinces, with a
total length of 5,464 km,
basin area795,000 km2
and, finally empties itself into the Bohai sea (Including isolated inflow area 42,000 km2) . It is the
second largest river in
The regions above Tangnaihai hydrologic station are the main
runoff generation areas which contribute more than 35% of the total runoff with
15.3% of the total area, and are less affected by human activities. In the
1990s runoff of Tangnaihai hydrologic station experienced a serious decrease which had attracted considerable attention(Wang,
2003; Zhang et al., 2004; Liu, 2004). Liu
C M(2002) investigated the Changes in
components of the hydrological cycle in the
This paper tries to detect factors impacting on baseflow in the source regions of the Yellow River basin during the second half of the 20th century, by applying correlation analysis. The second section deals with data availability and the methodology used. In the next section of the paper, a simplified description of the improved Kalinin baseflow separation technique is introduced, and they provide the base for further analysis in the following sections. The fourth section presents the results and impacts of climate change baseflow are discussed. The paper ends with a short summary.
Study Area and Data Sources
The
source regions of the Yellow River referred as the regions above Tangnaihai
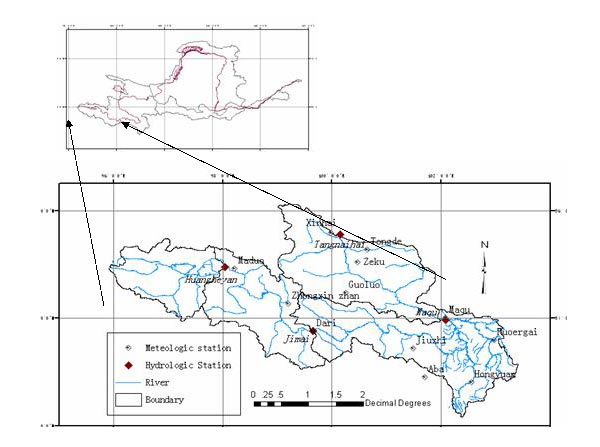
hydrological station in the Yellow River basin, locates between 95°50’45”E-103°28’9”E
and 32° 12’11”-35°48’7”N(Figure 1) with the area of 122217Km2. The study area
is in the
northeast of the Qinghai-Tibet Plateau which is 3000 ~5000m above the sea level
and famous as Roof of the World. The
elevation ranges from the peak of Alnima of 6282m to the
Due to the low population and economic development level in the area, very few data collection points exist in the basin. Figure 1 present and list the location of the hydrometeorological used herein. The precipitation and temperature of each subbasin are computed using arithmetical mean of the metrological data of the subbasin.
Method
Pearson correlation coefficient
Pearson’s correlation coefficient, which functions as a measure of similarity between variables, measures the strength and direction (decreasing or increasing, depending on the sign) of a linear relationship between two variables X and Y and can be defined as:
 (1)
(1)
Where ![]() and
and ![]() denote the means of the two
variable. Let A and B be climate factors and runoff respectively
in the sample. The row X denotes the value of the climate, while the row
Y denotes the value of the climate. If A and B are relative
agreement, then the value of r will be high, whose positive (negative)
sign tokens linear increasing (decreasing). A nonparametric method is suggested
to estimate the statistical significance of a computed correlation coefficient.
denote the means of the two
variable. Let A and B be climate factors and runoff respectively
in the sample. The row X denotes the value of the climate, while the row
Y denotes the value of the climate. If A and B are relative
agreement, then the value of r will be high, whose positive (negative)
sign tokens linear increasing (decreasing). A nonparametric method is suggested
to estimate the statistical significance of a computed correlation coefficient.
Baseflow separation
![]() ; the streamflow exceeding the outflow
from the reservoir is divided between recharge to the groundwater store and
direct runoff with a constant partitioning factor. This last assumption is a
gross simplification of reality. Kalinin baseflow
separation technique proposed by
; the streamflow exceeding the outflow
from the reservoir is divided between recharge to the groundwater store and
direct runoff with a constant partitioning factor. This last assumption is a
gross simplification of reality. Kalinin baseflow
separation technique proposed by
![]() (1)
(1)
Where:
![]() (2)
(2)
![]() is the average runoff of time step n-1 and n,
is the average runoff of time step n-1 and n, ![]() is the baseflow of time step n-1,
is the baseflow of time step n-1, ![]() is the recession constant, and
is the recession constant, and ![]() is a coefficient determined by trials
or errors or by experiences.
is a coefficient determined by trials
or errors or by experiences.

![]() and ratio coefficient β. The recession
constant is derived from recession curve during time periods with no or low
rain or recharge. Although
and ratio coefficient β. The recession
constant is derived from recession curve during time periods with no or low
rain or recharge. Although
Ratio coefficient β was determined on trials with the principle that each day the estimated baseflow should be less than streamflow. Theoretically, baseflow should coincide with recession curve in recession periods, but, in practice, as there exists some reading error or others factors affecting recession curve, there are some discrepancies between baseflow and recession curve. Thus according the climate characteristics of the study area, the following steps are proposed to separate baseflow:
Prepare input data one year at a time, including daily flow data, direct flow starting date(rising point as showed in Figure 4) and the recession constant;
Initialize coefficient β with a range. Define an interval to retrieve the coefficient β in the range from the low bound to the high bound. In this paper the coefficient β is initialized to the range of [0.5,4.0] and the interval is 0.01;
During time periods out of recession(namely the time periods from the rising point to flection point, see Figure 4), using ratio coefficient β retrieved in step (2) once at a time, daily flow data, and recession coefficient as input to function (1) to estimate baseflow process. If the estimated baseflow process intersect with streamflow process, discharge the ratio coefficient β, else storage it.
In
recession period(the periods after flection point in Figure 4) using the ratio
coefficient achieved in step (3) once at a time, daily flow data and recession
coefficient as input to function (1) to optimize the final ratio coefficient β.
Least square sum: ![]() is used as the optimization criteria.
Where
is used as the optimization criteria.
Where ![]() is the observed streamflow and
is the observed streamflow and ![]() is the estimated baseflow at time step i in recession periods.
is the estimated baseflow at time step i in recession periods.
Apply equation (1) to the whole calendar year with daily runoff, the β coefficient derived in step (4), the recession constant and the direct flow begin date-the rising point as showed in Figure 4 to separate baseflow from streamflow.
1) Repeat the steps (1) to (5) to separate baseflow from streamflow of the next year, until the ending year.
These improvements reduced the input parameters and make the baseflow separation process more simple and objective.
Fig. 3
Computation of recession coefficient of Tangnaihai Hydrologic Station of 1958

Fig. 4 The runoff component separation of Tangnaihai hydrologic station of of 1958
Results and Discussions
Dynamic variation of the baseflow in the source regions of the Yellow River
Table 2 shows the fundamental hydrologic characteristics of the study area with average annual precipitation of 640.67×10⁸m3, runoff of 203.8×10⁸m3, temperature of -0.52℃ and baseflow of 132.46×10⁸m3. BFI is the abbreviation of Baseflow index means the ratio of annual baseflow to runoff.
Table 1 Baseflow of the source regions of the Yellow River
|
Time periods |
Precipitation |
Temperature |
Runoff |
Baseflow |
BFI |
|
1956-1960 |
541.52 |
-0.98 |
162.02 |
108.30 |
0.670 |
|
1961-1970 |
638.37 |
-0.96 |
214.57 |
136.14 |
0.641 |
|
1971-1980 |
649.29 |
-0.61 |
208.66 |
138.52 |
0.658 |
|
1981-1990 |
681.80 |
-0.40 |
238.84 |
150.61 |
0.632 |
|
1991-2000 |
642.79 |
0.11 |
174.73 |
116.63 |
0.668 |
|
1956-2000 |
640.67 |
-0.52 |
203.96 |
132.46 |
0.652 |
Fig. 5 plots of annual baseflow against annual precipitation in the source regions of the Yellow River
Fig. 6 plots of 10 years averages precipitation against baseflow index of the source regions of the Yellow River
Mean baseflow and precipitation are highest in the 1980s and lowest during time periods of 1956 to 1960 among the time periods listed in table 1.There existed good linear relationship between annual baseflow and precipitation, and with the increase of precipitation baseflow will increase (Figure 5). Points of the plot of mean baseflow index against precipitation of every 10 years shows a strong negative linear relation (Figure 6) while those of the plot of annual mean precipitation against baseflow index are scattered. These facts showed that precipitation had noticeable impacts on baseflow index on 10-year-scale while had nearly no impact on annual time scale. This may due to the increase or decrease trend of precipitation in long term will affect the Surfcial or subsurfcial features to change the runoff generation processes, and so change the relative volume of direct flow and baseflow. Surfcial features include area, shape, channel network, slope, vegetation, roughness and land use. Subsurfcial features are soil texture, structure and type; porosity; stratigraphy; hydraulic conductivity; and geological controls. The study regions locate in the highland, the human activities is relative weak. The rising rate of temperature is 0.51℃/10a in the 1990s which are significant greater than that of other time periods as listed in table 1. Since the human activities and precipitation remains relatively stable we can conclude the decrease of runoff and baseflow in the 1990s can be attributed to the quickly rising of temperature.
Dynamic change of the baseflow of subbasins of the study area
Separate baseflow from streamflow of Tangnaihai, Maqu, Jimai and Huangheyan hydrologic station with daily flow data, then accumulate the daily series to annual series. The baseflow, direct flow and total runoff of each subbasin presented in Figure 1 are computed; correspondingly the precipitation and temperature in each subbasins are calculated from the meteorological station in each subbasin.
Table 2 Baseflow of the Head regions of Yellow River
|
Time periods |
P |
T (℃) |
R |
Baseflow |
BFI |
|
1956-1960 |
65.73 |
-3.85 |
3.20 |
2.12 |
0.632 |
|
1961-1980 |
58.95 |
-4.29 |
6.81 |
3.83 |
0.527 |
|
1981-1990 |
67.74 |
-3.78 |
10.40 |
6.65 |
0.578 |
|
1991-2000 |
69.48 |
-3.38 |
3.92 |
2.49 |
0.532 |
|
1956-2000 |
65.01 |
-3.85 |
6.40 |
3.92 |
0.556 |
Head regions of Yellow River are the area above Huangheyan hydrologic station of the Yellow River with area of 20930 Km2. The area is really cold and arid with annual average temperature of -3.85 °C and precipitation of 65.524×10⁸m3. The elevation is above 4200m. There were 4077 lakes in 1950s among which 48 lakes was bigger than 0.5 Km2, and the total water area were 1664.6Km2 which was7.95% of the Head regions.
The average annual runoff is 6.40×10⁸m3, and baseflow of 3.82×10⁸m3 which accounts for more than half of the runoff. The average baseflow index is 0.556. The correlate coefficients of precipitation and temperature against baseflow can’t pass the test of significance at the level of 0.05 using value of annual or even moving average of 5 years. This result shows in this region temperature and precipitation has no or low effect on baseflow in short time period. Zhang Shifeng et al (2004) showed that in this region the actual evaporation is in direct portion to temperature, and the soil water storage is continuous decrease. There were only about 2000 lakes in the 1990s which is half of that in 1950s and water level of the lakes had decreased seriously. The temperature rising rate averaged 0.32/10a(Figure 7) from 1956 to 2000 and 0.40/10 in the 1990s(Table 2). The quickly rising of temperature increased the actual evaporation and accelerates the smelt of frozen soil. With the smelt of frozen soil the groundwater level and lake water level will move downward, and thus may result in the decrease of water supply of baseflow from soil and lakes. So we can easily explain the seriously decrease of baseflow in the 1990s while annual mean precipitation in the 1990s is the biggest.
Fig.7 Annual Temperature of Maduo metrological station since 1956
Table 3 baseflow in subbasin between Huangheyan and Jimai hydrologic station
|
Time periods |
P |
T (℃) |
R |
Baseflow |
BFI |
|
1959-1967 |
89.62 |
-3.98 |
32.71 |
19.51 |
0.599 |
|
1976-1989 |
99.65 |
-3.89 |
37.30 |
20.85 |
0.583 |
|
1991-2000 |
95.26 |
-3.63 |
28.67 |
16.60 |
0.581 |
|
1959-2000 |
95.79 |
-3.84 |
33.61 |
19.27 |
0.588 |
The area of subbasin between Huangheyan and Jimai hydrologic station is 25479Km2, with the elevation above 4000m. This subbasin is relative cold and arid with average annual temperature of -3.84°C, annual average precipitation of 95.79 ×10⁸m3. The annual average runoff is 33.61×10⁸m3, baseflow of 19.27×10⁸m3 and baseflow index of 0.588.
Precipitation and baseflow shows a good linearship while points of the plot of baseflow against temperature are relative scattered on annul time scale. The correlation coefficient with moving average of 3 years of temperature against baseflow is -0.523 which could pass the test of significance at the level of 0.01. Thus conclusion could be made that in this region precipitation and temperature both have significant impact on baseflow but the extent and response rate are different: precipitation’s impact is stronger and more quick than that of temperature. Table 3 shows that the temperature rising rate in the 1990s is 0.33℃/10a which is higher than any other time periods listed in table 3. In the 1990s the decrease of precipitation and the increase of temperature contributed largely to the significant decrease of baseflow.
The
area of the Subbasin between Jimai and Maqu hydrologic stations is 40580km2 and elevation is above 3400m. The pondage ability is
noticeable for the well developed river network and large tributaries of Heihe River,
Baihe River
on the right side of the Yellow River
in this region(Figure 1). Heihe River
and
Table 4 baseflow in subbasin between Jimai and Maqu hydrologic station
|
Time periods |
P |
T (℃) |
R |
Baseflow |
BFI |
|
1960-1970 |
268.02 |
-0.56 |
108.99 |
72.77 |
0.676 |
|
1971-1980 |
270.51 |
-0.20 |
105.63 |
70.29 |
0.665 |
|
1981-1990 |
280.74 |
0.02 |
122.25 |
73.49 |
0.596 |
|
1991-2000 |
246.35 |
1.26 |
88.54 |
58.13 |
0.656 |
|
1960-2000 |
266.56 |
0.10 |
106.40 |
68.82 |
0.649 |
The correlate coefficient of annual precipitation against baseflow is 0.618 which is significant at the level of 0.01. Correlate coefficient of annual temperature against baseflow is -0.353 which could pass the test of significance at the level of 0.05. In this subbasin precipitation and temperature are two important factors influencing baseflow but the impact of precipitation is more pronounced than that of temperature on baseflow.
Figure 8 shows that average precipitation and baseflow index of each ten years has good negative linear relationship. From table 4 we could see baseflow index reach maximum in 1960s and minimum in 1980s and the temperature rising rate before 1990 was 0.2℃/10a while 1.2℃/10a in the 1990s. According to the change of baseflow index we could conclude that in the 1990s the decreasing rate of baseflow was greater than that of direct runoff and the impact of temperature on baseflow is significant than that on direct flow in 10 years time scale in this region.
Fig. 8 plots of means of 10 years precipitation against baseflow index of subbasin between Jimai and Maqu hydrologic station
Subbasin between Maqu and Tangnaihai hydrologic stations, with area of 35228Km2 and elevation above 2700m, annual average precipitation of 143.099×10⁸ m3, annual average temperature of 0.53°C , annual average runoff of 59.712 ×10⁸ m3 , average baseflow index of 0.704. Runoff, precipitation, experienced a serious decrease in 1990s while temperature and baseflow index are higher than the average (Table 2).
Table 5 baseflow in subbasin between Maqu and Tangnaihai hydrologic station
|
Time periods |
P |
T (℃) |
R |
Baseflow |
BFI |
|
1960-1970 |
143.64 |
0.18 |
60.02 |
40.05 |
0.673 |
|
1971-1980 |
145.26 |
0.48 |
59.37 |
41.61 |
0.680 |
|
1981-1990 |
158.88 |
0.73 |
71.32 |
49.88 |
0.703 |
|
1991-2000 |
124.57 |
0.76 |
48.11 |
36.77 |
0.762 |
|
1960-2000 |
143.10 |
0.53 |
59.71 |
42.03 |
0.704 |
The correlate coefficient of baseflow against precipitation is 0.616 which are significant at the level of 0.01 while the correlate coefficient of baseflow again precipitation can’t pass the test of significance even with moving average of 5 years which shows in this region the baseflow only influenced by precipitation in short term. Significant decrease of precipitation in the 1990s is a vital factor attributes to the decrease of baseflow.
Summary
While worth be noticed is there are many glaciers, in this paper the influence of glaciers on baseflow are not discussed. With the increase of temperature the snowmelt runoff will increase so the impact of decrease of precipitation or increase of temperature on the baseflow will more strong. And also Because of the sparsely of the meteorological station more efforts should be afford to monitor changes of the precipitation and temperature and subsurfical or surfical condititions.
Acknowledgment
Funding for this study was provided by the Major State Basic Research Development Program of China (Grant No: G19990436-01) and Chinese National Natural Science Foundation(NO.40471127).
References:
[1] Burn D H, Elnur MAH. 2002. Detection of hydrologic trends and variability[J]. Journal of Hydrology 255: 107–122.
[2] Liu C M, Zeng Y, 2004. changes in pan evaporation in the recent 40 years in the Yellow River. Water international[J]. 29(4):510-516.
[3] Ding Z L, Hu K D, Fang Y Y, 2003.Analysis and discussion of dividing up groud water by the Kalinlin improving method[J]. Jiangxi Hydraulic science and technology, 4:211~215.
[4] Wittenberg H., Sivapalan M, 1999.Watershed groundwater balance estimation using streamflow recession analysis and baseflow separation[J]. J. Hydrol., 219:20–33.
[5] Liu C M,
Zheng H X., 2002. Hydrological cycle changes in
[6] McCarthy J J, Canziani O F, Leary NA, Dokken D J, White KS (eds). 2001. Climate change 2001: impacts, adaptation, and vulnerability. http://www.grida.no/climate/ipcc tar/wg2/index.htm.
[7] Thomas A.
2000. Spatial and temporal characteristics of potential evapotranspiration
trends over
[8] Smakhtin V.U. , 2001. Low flow hydrology: a review[J]. Journal of Hydrology,240: 147–186.
[9] Vogel, R.M., Kroll, C.N., 1996. Estimation of baseflow recession constants[J]. Water Resour. Managem,10, 303-320.
[10] Wang G X, Shen Y P, Liu S Y, 2003. On the Characteristics of Response of Precipitation and Runoff to the ENSO events in the source regions of the Yellow River[J]. Journal of Glaciology and Geocryology, 18 (5) : 595-602
[11] Wang W K, Kong J L, Duan L. et al, 2004. Rearch on the conversion
relationships between the river and groundwater in the Yellow River Drainage
area[J]. Science in
[12]
Zhang S F, Jia S F, Liu C M. et al., 2004.
Study on the changes of water cycle and its impacts in the source region of the
Yellow River[J].Science in
[13]
Zheng H X, Liu C M, 2003. Changes of Annual
Runoff Distribution in the Headwater of the