


Achievements
IDENTIFY THE LEVEL OF SHALLOW GROUNDWATER USING REMOTE SENSING TECHNOLOGY--A TRIAL STUDY CASE IN YELLOW RIVER DELTA
Shi Yingchun,Guo Jiao,Bi Zhiwei
Abstract: Using remote sensing technology to identify the distribution of groundwater level is tried in new Yellow River delta. This method stands on that there are only a few types of surface cover, the structure of each community of vegetation is simple and a certain type of vegetation community has a range of groundwater level in this area. This method comprises three steps. (I) interpret the types of vegetation community using TM image; (II) identify the vegetation communities and the range of groundwater level in distribution area of each type through the field work; (III) verify the results of interpretation and map the regional groundwater level after above two steps. This method can be treated as the earliest work for more detailed groundwater level survey.
Key words: remote sensing, vegetation community, groundwater level, Yellow River delta
Introduction
The level of groundwater is an important parameter over an area, especially that of the shallow groundwater, because it is related with the local bio-environment. In general, the normal method to know the groundwater level is using wells directly.
Yellow river delta is the youngest delta in the world and is one of the three biggest deltas in
On one hand, many studies proved that certain vegetation types grow in area with certain ranges of groundwater level and the fluctuation of groundwater is the main reason resulting in the evolution of the vegetation communities. Ma xinghua et al [1] found
that the growth and decay of some vegetation types have dynamic balances with the level of groundwater.
Gong bin and Wan li et al [2] brought forward that the coverage rate of vegetation in the lower reach of
From above all, the types of vegetation communities were ever identified through remote sensing, and it is proved that vegetation communities show the shallow groundwater level well, therefore, using remote sensing to identify the groundwater level through the media of vegetation communities in some area has some meaning.
1 The General Condition of the Study Area
The study area is situated in the northern part of the new Yellow river delta, from east longitude 118º38′ to 119º05′ and northern latitude 37º45′ to 38º10′ (fig.1). It belongs to the monsoon area with trenchant four seasons. The average temperature in a year is about 11.7℃~12.6℃, and the mean yearly rainfall is 530~630mm, but 70% of rain fall in summer. The mean yearly evaporation is 1900~2400mm. The ratio of evaporation to precipitation is about 3:1.
The study area is rather flat, but some tiny topography types, such as hillocks, slops and depressing area also exist. Totally, the landscape is a little high in southwest and a little low in northeast. It means that it is a little high near to the river and a little low far to the river. The shallow groundwater is unconsolidated pore water and its level is less than 3 meters. Most of the shallow groundwater is saline.
Fig.1 The location of study area
 The formation of the delta is due to the swing of the end of the Yellow River, and the parent material of the soil is alluvial deposit of the river [5]. The soil salinization is at large in the area.
In study area, there are only a few types of vegetation, including natural vegetation and artificial vegetation. The natural vegetation consists of herbaceous vegetation, such as reed, iodine weed, and the ligneous vegetation, such as Tamarix Chinensis and S. integ ra. The natural vegetation distribute as communities. The composition of vegetation in all communities is simple and not stable [6] [7]. Besides the natural vegetation, the study area has artificial vegetation. Most of them are cotton. With the amelioration for the soil in the delta, more trees were planted.
2 Methods
2.1 Field survey and sample taking
From Nov. 4 to 18, 2004, the study group went to study area for field survey and sample taking. November was chosen because during the period of June to September, it is rain season, while in November, the groundwater level is comparatively stable and the soil layer is not frozen. The field work consisted of three steps: the first, make sure the types of vegetation communities and position each community using the handy GPS instrument. The second, at the typical vegetation community, dig a pit to the groundwater table and after the stabilization of water table, and then measure the depth from the surface to groundwater table. The depth represented the groundwater level of the vegetation community. The third, during the process of water table being stable, take soil samples, including undisturbed and disturbed, on different layers of soil profile. Because the field survey was only related with vegetation communities, surface water area and coastal beach were not included this time.
Through the field survey, the groundwater level in study area is shallow enough and large area of cotton field is not in need of irrigation, so the groundwater level is not affected by human‘s activities. The simple communities of the vegetation and the flat topography provide a good place for identifying the groundwater level through interpreting the vegetation communities on remote sensed image.
2.2 Analysis
After the field work, the soil samples were sent to laboratory. The test items for the disturbed soil samples and undisturbed samples were granulometry and soil moisture, porosity respectively.
2.2.1 Indicating vegetation communities in study area
On the basis of former research and the field survey, besides the natural communities of Tamarix chinensis, iodine weed and reed, there are some dotted weed and statice communities. Their distribution area is not much, not reflecting the groundwater level in large area, so only three big natural communities were considered. They are Tamarix chinensis, iodine weed and reed.
Besides the natural communities, there are some artificial vegetation, such as cotton, acacia tree and the poplar tree. Under the condition of that the groundwater level is less than 3 meters, because the cotton and all planted trees in study area cannot tolerate too much water around their roots, too shallow water level can make the cotton and trees suffer the waterlog. So, the author thought that when human grew the cotton and all kinds of trees they have considered the local groundwater level. Therefore, though the distribution of cotton and artificial forests were decided by human, they could be treated as indicating vegetation communities for interpreting the shallow groundwater level. There are some types of artificial forests in study area, but it is not easy to subdivide all the types of forests on the TM image and their acreage are not too much, so the artificial forests are not subdivided this time. Therefore, the indicating artificial vegetation communities include cotton and artificial forests.
2.2.2 Main factors affecting the distribution of vegetation communities
In general, the evolution of the vegetation communities is affected by many factors, including the soil texture, soil moisture, soil salinity, groundwater level and the dissolved solid in groundwater. Because the groundwater level is shallow, among these affecting factors, soil moisture and soil salinity have direct correlation with groundwater level and dissolved solid in groundwater respectively, these affecting factors are generalized to three, they are soil texture, groundwater level and soil salinity.
From the table 1, the soil particle’s density is almost same; as well the average grain size and the porosity of soil have not notable difference in distribution area of vegetation communities. It indicates that all soil in distribution area of each vegetation community has the same origin and the soil texture is not the main factor affecting the distribution of vegetation communities.
Therefore, the ultimate causes affecting the evolution of the vegetation communities are the groundwater level and the soil salinity. Table 1 show that the vegetation communities have different abilities of salt-tolerant. The salt-tolerant abilities of planted trees, reed, cotton, tamarix chinensis and iodine weed are increasing. Vice versa, the vegetation communities indicate both the regional distribution of the shallow groundwater level and the soil salinity.
2.2.3 Interpreting of vegetation communities
The main TM image was acquired over the Yellow River delta on Oct. 28, 2004, four days before the field work. The assistant image was acquired on May 2, 2000. The interpreting software ERDAS imaging was adopted. After the comparison, the band combination 4, 3, 2 was the best one. Using the color and the texture information of multi-bands, multi-steps of supervised classification was adopted.
Table 1 the parameters of soil in distribution area of each vegetation community
|
Vegetation community |
Average grain size of soil
|
Soil particles’ density (g/ cm3) |
Porosity of soil (%) |
Soil salinity (%) |
|
cotton |
3.62-7.77 |
2.70-2.74 |
47.7-56.1 |
0.10-2.42 |
|
tamarix chinensis |
4.88-6.71 |
2.70-2.74 |
45.7-55.3 |
0.43-3.72 |
|
iodine weed |
4.70-6.68 |
2.70-2.71 |
48.8-57.4 |
0.25-4.60 |
|
reed |
4.81-6.32 |
2.71-2.73 |
49.0-60.8 |
0.10-1.53 |
|
Artificial forest |
5.20-5.98 |
2.70-2.73 |
56.0-59.7 |
0.30-0.55[] |
Remark: ![]() —Average grain size of soil(Φ unit),Φ=-log2d,d: Soil particles’ actual size
—Average grain size of soil(Φ unit),Φ=-log2d,d: Soil particles’ actual size
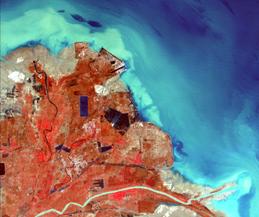
Fig.2 TM image in study area on Oct. 28, 2004 (4, 3, 2)
The color, texture and geography characteristic of each surface coverage on TM image of Oct. 28, 2004 (4, 3, 2) is as follows.
Coastal beach: silver white, speckled textures and close to the sea.
Iodine weed vegetation communities: intermingle evenly with mahogany and offwhite, close to the sea or the coastal beach.
Tamarix chinensis communities: most are dark mahogany, the rest are bright mahogany, speckled textures, small distribution areas.
Reed communities: dark mahogany. In some place are confused with the tamarix chinensis communities, but the reed communities have large distribution area, with thread textures.
Iodine weed mingle with reed: the color is between the iodine weed communities and the reed communities, with large distribution area.
Cotton: pink color, evenly small rectangular plots with large distribution area.
Artificial forests: bright red, big rectangular plots.From above information, the distribution of vegetation communities in study area is in fig 3.
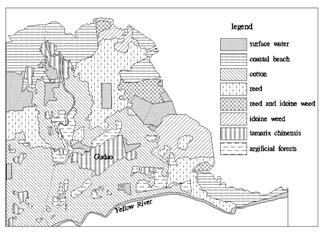
Fig.3 The interpretative vegetation communities in study area
Table 2 ranges of shallow GWL in each vegetation community
|
Vegetation community |
Ranges of GWL |
|
Reed community |
0.60~0.73 |
|
Transition area from reed to iodine weed |
0.99 or so |
|
Iodine weed community |
1.12~1.25 |
|
tamarix chinensis community |
1.04~1.37 |
|
cotton |
1.62~2.27 |
|
Artificial forests |
2.05 or so |
2.2.4 The groundwater level in each vegetation community
The measured ranges of groundwater level in each vegetation community are on table 2.
Because the distribution of groundwater is continuous and smoothing, the range of groundwater level was generalized. From the fig 4, the groundwater level in reed communities was most shallow, between 0.58-0.85m; the groundwater level in tamarix chinensis communities and iodine weed communities was middle, between 0.85-1.35m and that of cotton and artificial forests was deepest, between 1.35-2.30m. Because the groundwater level was in the same ranges in tamarix chinensis communities and iodine weed communities’ distribution area, and same range in distribution area of cotton and artificial forests, the map of groundwater level in study area was mapped as fig 5.

Fig.4 The relation between shallow GWL and vegetation communities
Remark: “tamarix ch” is the abbreviation of tamarix chinensis communities, “iodine weed” is
the abbreviation of iodine weed communities, “forests” is the abbreviation of artificial f
orests. “reed” is the abbreviation of reed communities.
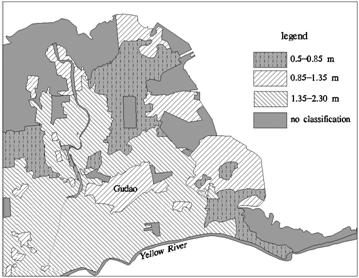
Fig.5 The distribution of groundwater level in study area
3 Results and Discussing
On the basis of above analysis, the GWL between 1.35-2.30m accounts for 40.3% of total area, mainly on two sides of Yellow River and old course of Yellow River with low soil salinity. GWL between 0.85-1.35m accounts for 17.2% of total area, and that between 0.50-0.85m accounts for 16.3% of total area, mainly in the depression area. 26.2% of total area is occupied by coastal beaches and surface water, no vegetation, so no classification.
In general, only the spectrum of surficial vegetation and soil is recorded on remote sensed images, so the information under the deep soil cannot get directly through remote sensing. And that the shallow groundwater level is changing with the seasons, so, the author thought that under the current remote sensing technology, identifying the groundwater level using the remote sensing technology directly is difficult. But the growth of all the vegetation depends on the soil moisture and soil moisture has close relationship with the shallow groundwater level, so, in the area with a few vegetation communities and the communities’ structure is simple, using remote sensed image can identify the general distribution of groundwater level. It can be treated as the earliest step for more detailed groundwater level survey.
The problems should be discussed further:
The quantitative relation between the soil salinity and groundwater level affecting the distribution of vegetation communities.
The quantitative relation between different coverage rate of vegetation and the groundwater level.
References
[1] Ma Xinghua,Wang Sang.Relationship between the Retrogression of vegetation and groundwater level, total salinity of water in
[2] Gong Bin,Wan Li,Hu Fusheng et al. Degradation and controlling factors of the Ejina Oasis in the downstream
[3] Xu Hailiang,Chen Yaning,Yang Ge.Effect of translating water on Vegetation at the lower reaches of Tarim river.Environmental Science, 2003, 24(4): 18-22.
[4] Gao Zhanguo,Zhang Liquan.The identification of spectral characteristics of salt marsh vegetation using indirect ordination.Remote sensing for Land and Resources, 2006(2): 51-56.
[5] Song Yumin, Zhang Jianfeng, Xin Shangjun, Xi Jinbiao. Features of plant community and its restorationtechniques in Yellow River Delta region. Journal of Northeast Forestry University, 2003, 31(6):87-89.
[6] Xin Shangjun, Xi Jinbiao, Zhang Jianfeng et al. the basic characteristics and the main types of vegetationin the Yellow River delta region. Journal of
[7] Shao Qiuling, Xie Xiaoding, Li Fazeng. Studies of flora of Yellow River Delta National Reserve Area..Acta Bot Boreal Occident Sin. 2002, 22(4): 947-951.