


Achievements
INFLUENCE OF A DAM ON A DOWNSTREAM COASTAL AQUIFER (MOTRIL, GRANADA, SOUTHERN SPAIN)
Calvache, M.L., Ibáñez, S., Martn-Rosales, W., LÓpez-Chicano, M. and Duque, C.
Departamento de Geodinmica, Universidad de Granada, Avda. Fuentenueva, s/n, 18071 Granada, Spain
Corresponding author: calvache@ugr.es
Key words: saltwater intrusion, Rules dam, mathematical modelling, Motril-Salobreña Aquifer, coastal aquifer.
1 Introduction
Until now, the Motril-Salobreña detritic aquifer has been one of the few systems on the Mediterranean coast to remain relatively unaffected by contamination from seawater intrusion. This fortunate state of affairs is due to the fact that the main source for the aquifer is the Guadalfeo river, which derives from melt runoff from the Sierra Nevada. It thus provides the highest flow when most needed (ie. during the hottest weather). Up till now, the surface waters have covered almost all needs for the area as regards urban water supply and both agricultural and industrial requirements. The few exceptions have occurred in the summer months and the driest years. The Rules dam has just come into operation in the Gualdalfeo river's basin, less than 20 km from the coastline (Fig. 1). The dam will have a capacity of approximately 120 hm3 and an average supply of 200 hm3/year. It will interrupt both surface and underground water flow since the base of the dam intersects the impermeable bedrock of the alluvial aquifer. Consequently, the main recharge of the Motril-Salobreña system will be considerably diminished, undoubtedly causing a change in the volume of water stored in the aquifer and therefore in the hydrodynamic and hydrochemical characteristics of the underground water.
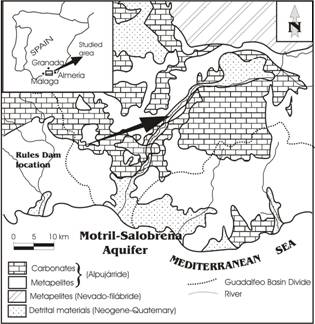
Figure 1. Geological location of the Motril-Salobreña aquifer.
This study presents the preliminary results from the application of a mathematical model. After calibrating and validating the model, we have performed a serie
mathematical simulations in an attempt to predict the influence the Rules dam will have on the Motril-Salobreña coastal aquifer. The results from the mathematical modelling reveal that the aquifer will be affected in two specific aspects: variations in the water table and the encroachment of the saline wedge. Considering these two aspects together with the demands on the aquifer provides us with the data needed to construct a vulnerability map. This map reveals zones with a greater or lesser risk of contamination or of too much desaturation.
2 Characterization of the Motril-Salobreña aquifer
The Motril-Salobreña aquifer, with an approximate area of 50 km2, mainly comprises alluvium supplied by the Guadalfeo river and its tributaries. The deepest part of the aquifer (250-300 m) lies close to the coast. It comprises the most important detrital aquifer on the coast in the province of Granada due both to its extension and to its water volume (Castillo and Fernández-Rubio, 1978; Pulido and Rubio, 1988; ITGE, 1991).
Geologically, the study area and its catchment basin belong to the Alpujárride Complex of the Internal Zones of the Betic Cordillera (Fig. 1). More specifically, this sector contains metapelitic material such as schists and phillites, considered impermeable to all practical effects, and marbles (Aldaya, 1981). Admittedly, the outcrops of carbonate material constitute good aquifers and, where they are in contact with the alluvium, will recharge the detrital aquifer to an extent that is difficult to assess. The alluvium comprising the aquifer consists of alternating levels of gravel, sand, silt, and clay in different proportions depending on the sector. In general terms, there is a high proportion of coarse-grained sediments (gravel and coarse sand), primarily in proximity to the current channel of the Guadalfeo and at depth in the location of its palaeochannels.
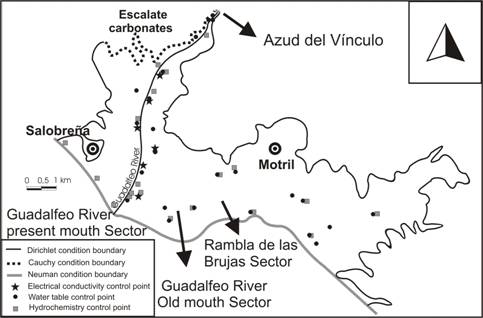
Figure 2. Location of the monitoring points for water table, hydrochemistry, and electrical conductivity, as well as types of boundaries considered in the mathematical model used for the Motril-Salobreña aquifer.
Another important recharge source for the aquifer is from irrigation water, as the surplus goes to replenish the subterranean resource. Note that most of the area modelled is farmed and irrigated by the traditional furrow irrigation. Precipitation is a significant recharge source as well, although in this sector it is quite scarce. Average precipitation is only 415 mm/year, much of which is lost through evapotranspiration. Other important recharge sources for the aquifer occur underground at the contact with the limestone aquifer of Escalate and in the continuation of the alluvium in the northwestern sector of the area, proceeding from higher areas of the basin.
The aquifer discharges naturally on its southern border into the sea with a very small proportion that discharging into the Guadalfeo river in the area closest to the coastline. Additional demand on the aquifer also occurs in the pumping wells used primarily for industry (a paper mill and a sugar mill), for municipal water supply, and for irrigation during periods of drought.
Monthly analyses of twenty-odd points in the Motril-Salobreña aquifer (Fig. 2) reveal it is low in salinity (conductivity levels range from 420 to 2040 μS/cm) with a dominant hydrochemical facies of mixed calcium-sodium bicarbonate.
To establish the location of the freshwater-saltwater interface and thus observe the possible influence of seawater on the Motril-Salobreña aquifer, we have carried out monthly monitoring of the electrical conductivity and temperature profiles at six points relatively close to the coastline (Fig. 2). In no case did we intercept the freshwater-saltwater interface, not even with a piezometer about 1000 m from the coastline that reaches a depth of 170 m. Profiles show conductivity corresponding to freshwater, with maxima under 1100 μS/cm.
It is thereby clear that, during the sampling period, the Motril-Salobreña aquifer was entirely unaffected by seawater intrusion, including during the summer period, when recharge is very low and usage very high.
3 Methods
The area to be modelled covered from Azud del Vínculo down to the coastline (Fig. 2) for two reasons: (i) the coastal boundary is of the greatest interest due to the influence of seawater, and (ii) the aquifer is widest and deepest in that zone. The thickness of the aquifer varies from a low of 30 m in its northern sector to 300 m in the coastal area. The contact of the aquifer with the sea (southern boundary) represents a constant limit both for the water table and for the salinity concentration, so it is considered to be a Dirichlet boundary condition. The contact with the impermeable schists (eastern, western, and northeastern borders) are boundaries where there is no flow; therefore, they are considered to be a Neuman boundary condition. The simulation of the northwestern boundary was more complex as there are two types of limits there. The first is the contact with the Escalate carbonate aquifer, represented by a Cauchy condition (the flow depends on the difference in level between the carbonate aquifer and the detrital aquifer). The second boundary is the continuation of the Guadalfeo river alluvium, considered to be a Dirichlet boundary condition (a known level, but one that varies for each period simulated). The model considered 12 horizontal layers with heterogeneous hydraulic conductivity and storage parameters for each layer.
The model has been calibrated taking into account the field data collected from November 2001 to October 2002, obtaining the water table and the location of the freshwater-seawater interface for the end of that period.
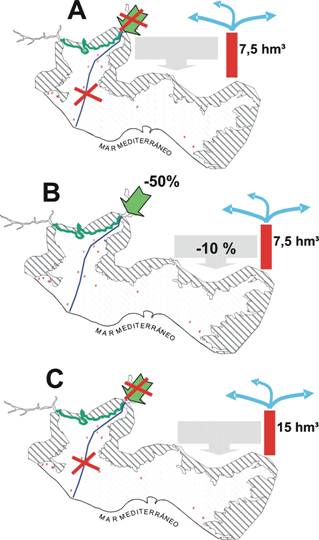
Figure 3. Conditions in the three scenarios simulated.
4 Scenarios
Once the models were calibrated and validated, we simulated diverse scenarios, modifying the components of the aquifer's hydrologic balance that could be affected when the Rules dam goes into operation. The simulation period was 10 years in order to offer a wider perspective on the impact on the aquifer.
We present just three of the scenarios given by Ibáñez (2005) (Fig. 3):
We consider the following changes with regard to the baseline year: 1) water recharge by the Guadalfeo river will vanish completely as the river's channel will be intercepted by the Rules dam; 2) underground recharge via the alluvium is also entirely eliminated since the dam will intercept the impermeable bedrock.
In this case we consider the following changes with regard to the baseline year: 1) elimination of water recharge from the Guadalfeo river; 2) a 50% reduction in groundwater inflow through the alluvium considering there may be inflow from other aquifers in the basin to the alluvium downstream from the dam; 3) a 10% reduction in surface recharge as improvements are foreseen in irrigation effectiveness that will result in decreases in current supplies.
The most extreme situation considers the following changes with regard to the baseline year: 1) elimination of recharge from the Guadalfeo river; 2) elimination of groundwater inflow through the alluvium; 3) a 10% reduction in surface recharge; 4) a twofold increase in the volume of underground water pumped out.
5 Results
Two effects can be distinguished in the system when varying the water recharge in the different scenarios. First, a change in the water table and, second, as a result, a modification in the location of the freshwater-seawater mixing zone.
In general, as regards variations in the water table for the distinct scenarios, the same tendency is seen in each case, with a decrease in variation from north to south and from west to east. The most affected sector, therefore, is in the northeastern area downstream from Azud del Vínculo. In scenario A, the results show drops in the water table greater than 15 m in the most affected sector. A decrease of as much as 8 m is also seen in the western coastal boundary. The table drops gradually, without reaching equilibrium within 10 years. In scenario B, the results are less extreme mainly due to the fact that it factors in an inflow to the aquifer through the alluvium of approximately 4 hm3/year. In this case, decreases in the water table in the most affected zone reach about 8 m and attain equilibrium within 7 years. In scenario C, which assumes the most unfavourable conditions, the model destabilizes in year 4 in the northwestern sector. The causes are the significant drops in the water table resulting from doubling aquifer extraction, leaving the aquifer desaturated.
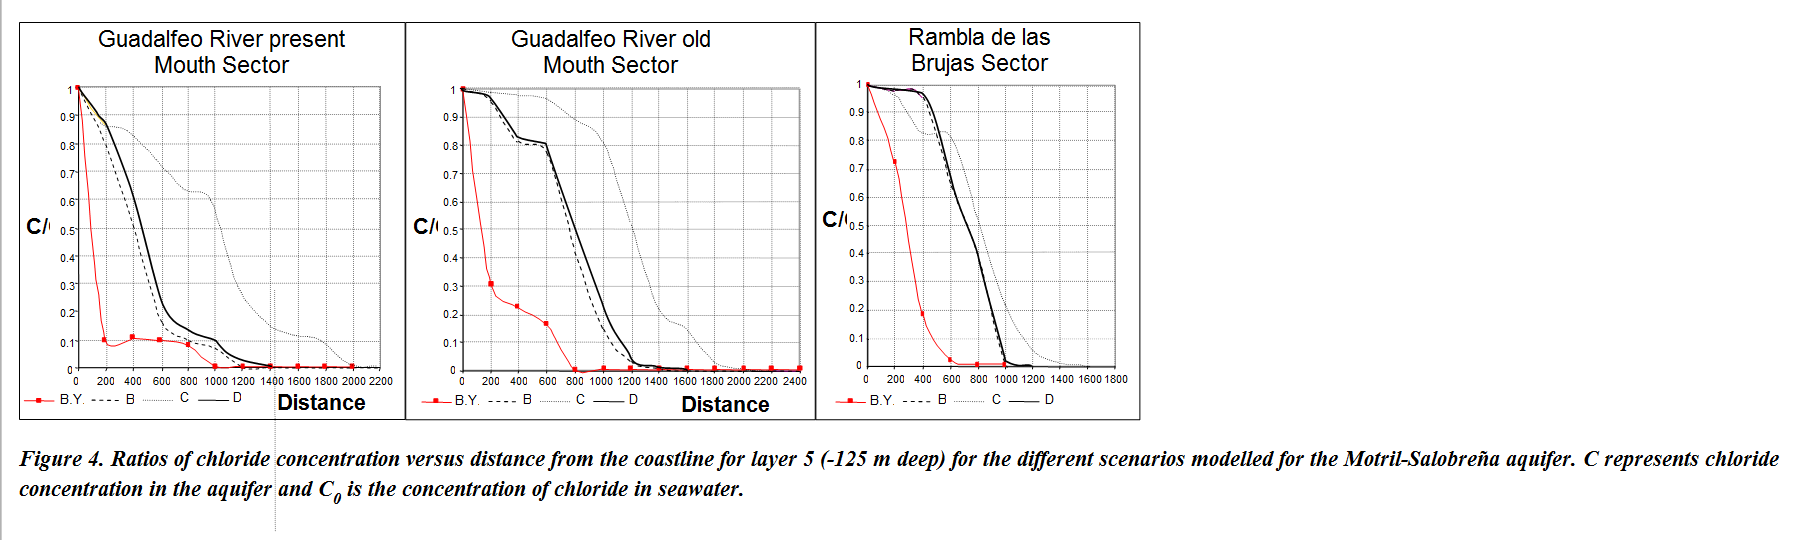
The advance of the saline wedge is most notable in those zones with the highest hydraulic conductivity. In order to make a comparative study, we selected three profiles representative of different sectors of the aquifer (Fig. 2). We then performed chloride concentration curves in relation to distance from the coastline, comparing them with results from the baseline year (Fig. 4). Since the results from scenarios A and B are very similar, we have only shown the curve for scenario B. In both these cases the saline wedge encroaches inland some 400-600 m by year 10. By the time scenario C destabilizes in year 4 of the simulation, the saline wedge has already advanced over 1500 m inland.
It is therefore obvious it will be crucial to exhaustively monitor seawater intrusion to the aquifer. Any encroachment could thus be countered by measures such flow augmentation from the Rules dam to feed the aquifer along its northwestern boundary.
6 Aquifer Vulnerability
Based on the above results as concerns variations in the water table and the saline wedge encroachment, we have established different zones in the aquifer according to their vulnerability to the effects of the Rules dam. The aim is to determine those areas that may be hit the hardest to thereby prevent contamination by seawater intrusion with appropriate resource management.
To undertake this analysis, three factors were taken into account: variation in the water table, as it is an indicator of the zones most affected by a decrease in recharge water volume of water pumped, an indicator of usage encroachment of the saline wedge, an indicator of the degree of contamination due to seawater intrusion.
We quantified these three factors in order to suitably evaluate the vulnerability of the aquifer in relation to them (Table I). Thus, in the case of variations in the water table, we applied a point system of 0-100 based on water table changes of 0-10 m. The volume of pumped water was also given a point system of 0-100 based on a pump flow of 0-10 hm3/year. The third factor, the encroachment of the saline wedge, is directly related to the hydraulic conductivity value of the materials comprising the aquifer and the proximity to the coast. Where the impermeable bedrock of the aquifer is above 0 m a.s.l., the presence of a saline wedge is considered unviable.
|
Punctuation |
VULNERABILITY FACTORS | ||
|
Water table change |
Pumpings |
Marine water intrusion | |
|
100 - 80 |
> 10 – 7 m |
> 10 hm3/year |
Very high K and near to the coast |
|
80 - 60 |
6 – 4 m |
9 - 6 hm3/year | |
|
60 - 40 |
3 – 2 m |
5 - 3 hm3/year |
High k and near to the coast |
|
40 - 20 |
2 – 1 m |
3 - 1 hm3/year |
Medium k and not very near to the coast |
|
20 - 5 |
< 1 m |
< 1 hm3/year |
Low k and far away from the coast |
|
5 - 0 |
No pumpings |
No saline edge | |
Table I. Punctuation of the three factors considered for the vulnerability map
The vulnerability of the distinct sectors established for the aquifer thus depends on the total points obtained from the point values assigned for each of the three factors (Table II).
The resulting vulnerability map (fig. 5) shows Zone 1, in the northwestern sector, as the most vulnerable. The main reasons are that, in this zone, the recharge water undergoes the greatest change and river infiltration is entirely lost, thus producing the most significant alterations to the water table.
|
VULNERABILITY RISK | |
|
Very High |
300 - 240 points |
|
High |
239 – 180 points |
|
Medium |
179 – 120 points |
|
Low |
119 – 60 points |
|
Without effects |
59 – 60 points |
Table II. Degree of vulnerability risk.
|
Zone 1 |
Zone 2 |
Zone 3 |
Zone 4 | |||||
|
Water table Variation |
> 10 – 6 m |
100 p |
6 – 3 m |
60 p |
< 1 m |
20 p |
<1 – 3 m |
20 p |
|
Water Pumped |
> 10 hm3 |
100 p |
9 – 5 hm3 |
60 p |
3 -1 hm3 |
20 p |
5 -1 hm3 |
20 p |
|
Saltwater Intrusión |
Little important |
30 p |
Little important |
70 p |
Very important |
100 p |
Little important |
21 p |
|
Vulnerability risk |
Very high |
230 p |
high |
190 p |
medium |
140 p |
low |
61 p |
Figure 5. Vulnerability risk in the Motril-Salobreña aquifer.
In addition, this area is also more heavily pumped than the others. Zone 2, the sector of the current river mouth, is the next most vulnerable, with middle-to-high values for the three factors.
The principal risk factor is seawater intrusion due to its location at the mouth of the Guadalfeo. If marine encroachment does occur, it will happen in shallow levels of the aquifer since hydraulic conductivity is high at this shallow depth. Zone 3, the sector containing the old river mouth, is rated at intermediate vulnerability, although in this case the three factors vary considerably in risk. On one hand, there is scarce pumping in the area and variations in the water table would therefore also be minimal. On the other hand, the risk of seawater intrusion is the highest along the coastline of this detrital aquifer. This high risk is due to the fact that the Guadalfeo disgorged into the sea here before it was channelized and diverted to its current location. The lithological columns of boreholes in the sector show highly permeable materials probably corresponding to palaeochannels. Zone 4, the eastern sector of the aquifer beyond the influence of the Guadalfeo, has low vulnerability since recharge will vary little there. In addition, materials in the area are low in hydraulñic conductivity, so the risk of seawater intrusion is also low. Pumping is not high except for a few localized exceptions.
The results of the vulnerability map suggest the advisability of a plan to both monitor changes in the system as regards the new hydrodynamic situation in zones of higher vulnerability and to establish certain guidelines for research management. Such guidelines might include limiting pumping or denying permits for new wells due to the high risk to system equilibrium. In Zone 1, for instance, it is certainly inadvisable to establish more pumping wells since this area will suffer the greatest drop in the water table due to its loss of recharge waters. If seawater intrusion is noted in Zones 2 and 3, recharge should be undertaken in Zone 1 since it is in contact with those zones through the current channel of the Guadalfeo and, likely, through the palaeochannels leading to Zone 3.
Acknowledgements
This study was made possible by funding approved for projects REN2000-1377HID y CGL2004-02748/HID. Christine Laurin is thanked for the English translation.
References
[1] Aldaya, F. 1981. Hoja nº 1056 (Albuñol del Mapa Geológico de España a escal 1:50000. IGME. Madrid.
Calvache, M.L.
[2] Calvache, M.L.; Rubio, J.C.; López-Chicano, M.; González-Ramón, A.; Ibáñez, S.; Martín-Rosales, W.; Soler, R.; Díaz-Losada, E.; Peinado Parra, T. 2003. Estado actual del acuífero costero de Motril-Salobreña previo a la puesta en funcionamiento de la presa de Rules. In Tecnología de la Intrusión del agua de Mar en Acuíferos Costeros: Países Mediterráneos. TIAC’03. López-Geta, J.A.; Gómez, J.D., De la Orden, J.A.; Ramos, G. y Rodríguez, L. (Eds.). IGME. Madrid, 77-85.
[3] Castillo, E. y Fernández Rubio, R. 1978. Hidrogeología del acuífero de la Vega de Motril-Salobreña. Bol. IGME, LXXXIX, 39-48. Madrid.
[4] Guo, W. y Bennett, G.D. 1998. Simulation of saline/fresh water flows using MODFLOW. Proc. MODFLOW’98 Conference. Golden, Colorado, USA: 267-282.
[5] Guo, W. y Langevin, C.D. 2002. SEAWAT – User's Guide to SEAWAT: A Computer program for simulation of three-dimensional variable-density ground-water flor. U.S.G.S. Techniques of Water – Resources Investigations, Tallahassee, Florida. Book 6, Chapter A7, 77 p.
[6] Ibáñez, S. 2005. Comparación de la aplicación de distintos modelos matemáticos sobre acuíferos costeros detríticos. Tesis doctoral. 304 p.
[7] ITGE, 1991. Investigación hidrogeológica para apoyo a la gestión hidrogeológica en la cuenca del Río Guadalfeo. (Granada). Manuales de Utilización de acuíferos. Madrid.
[8] McDonald, M.C. y Harbaugh, A. W. 1988. A modular three-dimensional finite-difference ground-water flow model. Techniques of Water-Resources U.S. Geological Survey Water-Resources Investigations. V6, A1, 586 p.
[9] Nevot, A. y Fernández Gutiérrez, R. (1990). Algunas consideraciones críticas sobre la evaluación de avenidas en el área mediterránea de España: estudio del episodio de octubre de 1973 en el río Guadalfeo. III Jornadas Españolas de Presas. Barcelona
[10] Pulido Bosch, A. y Rubio, J.C. 1988. Los acuíferos costeros de Motril-Salobreña. TIAC'88. 209-238. Almuñécar.
[11] Zheng, C. y Wang, P.P. 1999. MT3DMS, A modular three-dimensional multi-species transport model for simulation of advection, dispersion and chemical reactions of contaminants in groundwater systems; documentation and user's guide. U.S. AERDCC Report SERDP-99-1. Vicksburg, MS.