Groundwater Recharge with Its Ecology
GROUNDWATER RECHARGE AND DEPLETION DURING THE FREEZING-THAWING PERIODS IN INLAND BASINS IN NORTHWEST CHINA
Huatai Liu
(College
of Oceanography & Environmental
Science, Xiamen University,
Abstract: In the plain at the northern foot of the
Keywords: Groundwater Recharge; Groundwater Depletion; Freezing-Thawing Period; Inland Basins in Northwest China
Inland basins in Northwest China lie in a typical continental dry climate zone, featuring strong evaporation and little precipitation, with the plain in the basin normally receiving an annual precipitation of less than 100mm. Additionally, inland basins in Northwest China have a relatively long freezing-thawing period, generally starting from early November each year and ending in mid-March the next year, lasting approximately five months. The characteristics of aridity, limited precipitation, intense precipitation and extended freezing-thawing period have given rise to the uniqueness of groundwater recharge. In a non-freezing period, sub-precipitation has a very limited effect on the effective recharge of groundwater, whereas in the thawing period, thanks to the accumulation of moisture in the frozen soil stratum during the freezing period, groundwater receives a concentrated recharge during the thawing period; the amount and characteristics of groundwater recharge in the thawing period are sharply different from those in the non-freezing period [1]. As such, it is particularly important to conduct observation and research on groundwater recharge in the freezing-thawing period as they hold tremendous practical significance for understanding groundwater recharge in inland basins in the freezing-thawing period and for correctly evaluating groundwater resources.
1 Test Methods
1.1 Test site
The tests
were conducted on the groundwater balance test field of Xinjiang Geological
& Mineral Bureau. The test field is located on the suburbs of Changji City;
geographically, it’s a fine-soil flatland belt in the alluvial-proluvial plain
at the northern foot of the
1.2 Instrument & samples
The
instrument used for testing and observation was a common lysimeter, which consisted of an infiltrating
(evaporating) utensil, an aqueduct and an underground observation chamber, with
an observation accuracy of
±0.1mm. The infiltrating
(evaporating) utensil contained undisturbed soil samples, which were the three
typical soils on the plain at the northern foot of the
1.3 Observation methods
The amounts of groundwater recharge and depletion were observed with the Marriott bottle and infiltration catching bottle of the lysimeter. Observation was made every five days and the amount observed at the end of each month was taken as the amount of groundwater recharge of the month. A positive observed amount indicated that groundwater recharge had occurred while a negative observed amount indicated the groundwater had been depleted.
2 Test Results and Analysis
2.1 Process of the Growth and Disappearance of Frozen Soil and Snow Cover
The plain at
the northern foot of the
2.1.1 Formation and Thawing Process of Frozen Soil
On November 3, 1999, with the advent of strong winds and low temperatures, frozen soil began to form on the ground surface, initially with a mere thickness of about 1cm. Under the effect of temperatures at the ground surface, the initial thickness of frozen soil fluctuated; but, overall, the thickness of the frozen soil was rising, with the maximum thickness reaching 102cm (February 6, 2000). When it reached its maximum thickness, the frozen soil would stay stable for approximately 30 days. As the temperature rose, the frozen soil began to thaw at its base (March 9, 2000); shortly afterwards, the top layer of the frozen soil also started it thawing process (March 13, 2000); the thawing front rapidly approached the center of the frozen soil and eventually penetrated to a depth of 30cm below the ground surface (March 19, 2000). Clearly, the freezing process was much longer than the thawing process as the former lasted 126 days while the latter took only 11 days (Fig. 1).
2.1.2 Formation and Thawing Process of Snow Cover
On November 10, 1999, with dropping temperature and snowfall, snow cover began to take shape, reaching a thickness of about 3cm; but a few days later, it thawed. On November 17, 1999, another snowfall hit the area, again reaching a thickness of around 4cm. Afterwards, the thickness of the snow cover experienced a few fluctuations. On December 3, 1999, another heavy snowfall took place, bringing the thickness of the snow cover to 18cm. Subsequent snowfall on January 4, 2000 further increased the thickness of the snow cover to 42cm, making it the thickest snow cover in the year. After reaching its maximum thickness, the snow cover retained its thickness for a certain length of time until March 8, 2000. With rising temperature, the snow cover thawed rapidly and melted completely by March 16, 2000. Similar to the growth and thawing process of the frozen soil, the formation process of the snow cover was far longer than its thawing process as the former lasted 118 days while the latter took merely eight days (Fig. 1).
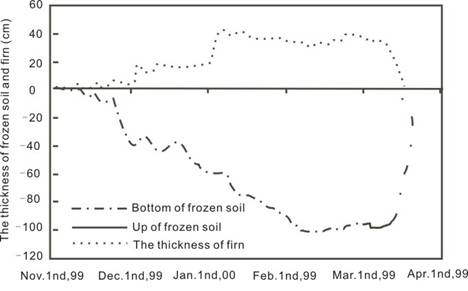
Fig. 1 Formation and Thawing Process of Frozen Soil and Snow Cover
2.2 Underground Recharge and Depletion of Sand Gravel
On November and December of 1999 during the freezing process, when the groundwater embedment depth was less than and equal to 0.5m, the groundwater recharge of sand gravel was a negative value, indicating that groundwater at this particular embedment depth primarily suffered depletion; however, the depleted amount was small, totaling 2.9mm in November and 1.6mm in December. In contrast, on November and December of 1999 and January and February of 2000 during the freezing process, when the groundwater embedment depth was larger than or equal to 1m, the groundwater recharge of sand gravel was a positive value, indicating that groundwater at this particular embedment depth primarily received recharge; however, the recharged amount was small, totaling merely 0.1-0.5mm (Table 1).
During the thawing period in March 2000, as the frozen soil layer and snow cover melted, groundwater received a concentrated recharge, and sand gravels of different groundwater embedment depths all received considerable groundwater recharge in March, with sand gravel at lower depth (0.5m) receiving a recharge of up to 83.2mm and sand gravels at depths of 1m and 1.5m receiving recharges of 64.9mm and 61.8mm respectively, which indicated that the recharged amount showed a declining tendency as the embedment depth increased (Table 1).
Table 1 Amount of Groundwater Recharge of Sand Gravel at Different Groundwater Embedment Depths (mm)
|
Time |
Groundwater Embedment Depth (m) | ||
|
0.5 |
1.0 |
1.5 | |
|
November 1999 |
-2.9 |
0.1 |
0.3 |
|
December 1999 |
-1.6 |
0.2 |
0.1 |
|
January 2000 |
ND |
0.1 |
0.1 |
|
February 2000 |
ND |
ND |
0.5 |
|
March 2000 |
83.2 |
64.9 |
61.8 |
Note: ND means that the soil at this particular embedment depth is completely frozen,
with neither groundwater recharge nor depletion.
2.3 Groundwater Recharge and Depletion of Fine Sand
In November and December of 1999 during the freezing process, when the groundwater embedment depth was less than and equal to 2m, the groundwater recharge of fine sand was a negative value, indicating that groundwater primarily suffered depletion, with the depleted amount ranging from 0.3m to 25.3cm, the smaller the depth, the greater the depletion. In November and December of 1999 and January and February of 2000, when the groundwater depth was larger than or equal to 3m, the groundwater recharge of fine sand became a positive value, indicating that groundwater primarily received recharge; however the recharged amount was small, ranging from 3.0mm to 4.8mm (Table 2).
During the thawing period in March 2000, regardless of the embedment depth, fine sand was primarily for groundwater recharge, and groundwater received considerable recharge, with the maximum recharge reaching 113.3mm (at an embedded depth of 0.5m). As the groundwater embedment depth increased, the amount of recharge received by groundwater dropped, with the recharge at an embedment depth of 3m being 27.0mm, merely 23% of the recharge at an embedment depth of 0.5m (Table 2).
Table 2 Amount of Groundwater Recharge of Fine Sand at Different Groundwater Embedment Depths (mm)
|
Time |
Groundwater Embedment Depth (m) | ||||
|
0.5 |
1.0 |
1.5 |
2.0 |
3.0 | |
|
November 1999 |
-25.3 |
-9.6 |
-2.4 |
-0.6 |
4.8 |
|
December 1999 |
-18.4 |
-1.7 |
-1.3 |
-0.9 |
4.6 |
|
January 2000 |
ND |
-2.6 |
-1.1 |
-0.5 |
3.1 |
|
February 2000 |
ND |
ND |
-0.6 |
-0.3 |
2.9 |
|
March 2000 |
113.3 |
75.5 |
69.3 |
55.4 |
27.5 |
2.4 Underground Recharge and Depletion of Silty Light Clay
In November and December of 1999 and January and February of 2000 during the freezing process, when the groundwater embedment depth was less than and equal to 4m, the groundwater recharge of silty light clay was a negative value, indicating that groundwater primarily suffered depletion, with the depleted amount ranging from 1.6m to 11.8cm, the greater the depth, the smaller the depletion. In contrast, when the groundwater embedment depth was larger than or equal to 5m, the groundwater recharge of silty light clay became a positive value; however, the recharged amount was small, ranging from merely 0.7mm to 1.7mm (Table 3).
During the thawing period in March 2000, at groundwater embedment depths of 0.5m and 1m, silty light clay also received considerable groundwater recharge from infiltration, but still less than sand gravel and fine sand, totaling 66.4mm and 40.9mm, respectively. In stark contrast to sand gravel and fine sand, the groundwater recharge during the freezing period at embedment depths of 1.5m, 2m, 3m and 4m remain a negative value, which means that groundwater still primarily suffered depletion. This is because at a groundwater embedment depth of 1m, the kinestate of soil moisture in the freezing period changed quickly from an evaporating type to an infiltrating type, allowing groundwater to receive enormous recharge rapidly; in contrast, at a groundwater embedment depth of 1.5m~4m, the kinestate of soil moisture in the thawing period first changed from an evaporating type to an infiltrating-evaporating type, which means that the kinestate of soil moisture on adjacent groundwater surface remained in an evaporating state and required considerable time before it was changed from the infiltrating-evaporating type to a completely infiltrating type[2] . This phenomenon also showed that silty light clay featured poor infiltration but strong moisture holding capacity; in March, time was no sufficient to turn the moisture kinestate of the entire soil profile into an infiltrating type; moreover, as the embedment depth increased, the process of the change from an infiltrating-evaporating type to an infiltrating type required longer time; the results showed that the infiltration front in late March had yet to reached the 1.5m embedment depth (Table 3).
Table 3 Amount of Groundwater Recharge of Silty Light Clay at Different Groundwater Embedment Depths (mm)
|
Time |
Groundwater Embedment Depth (m) | ||||||
|
0.5 |
1.0 |
1.5 |
2.0 |
3.0 |
4.0 |
5.0 | |
|
November 1999 |
-11.8 |
-5.9 |
-6.0 |
-5.6 |
-3.8 |
-2.4 |
1.7 |
|
December 1999 |
-11.0 |
-3.7 |
-3.9 |
-3.5 |
-3.3 |
-2.3 |
1.4 |
|
January 2000 |
ND |
-3.0 |
-3.0 |
-2.8 |
-2.8 |
-2.1 |
0.8 |
|
February 2000 |
ND |
ND |
-2.6 |
-2.1 |
-2.2 |
-1.6 |
0.7 |
|
March 2000 |
66.4 |
40.9 |
-1.9 |
-1.5 |
-1.6 |
-1.1 |
0.8 |
3 Comparison of Groundwater Recharge and Depletion of Different Lithologies
In the freezing period (November, December, January and February), at the same embedment depth, sand gravel underwent the lowest groundwater
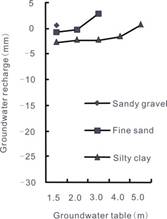
depletion, silty light clay experienced the highest groundwater depletion, and fine sand was in between (fine sand underwent greater depletion than silty light clay only when the embedment depth was smaller than 1m) (Fig. 2)
In the freezing period, where the groundwater embedment depth was lower than 1m, sand gravel experienced groundwater depletion; where the groundwater embedment depth was lower than 3m, fine sand underwent depletion; where the groundwater embedment depth was lower than 5m, silty light clay underwent depletion (Fig. 2). Obviously, areas with sand gravel and fine sand lithology are favorable for the protection of shallowly-embedded groundwater resources.
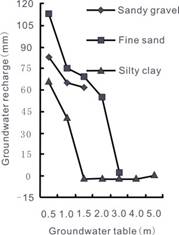
In the thawing period, at the same embedment depth, fine sand received the highest recharge, followed by sand gravel, with silty light clay receiving the lowest recharge (Fig. 2, March). The groundwater recharge of silty light clay had a lagging effect. Obviously, areas with fine sand and sand gravel lithology are favorable not only for the protection of groundwater resources but also for the formation of groundwater resources.
In the entire freezing-thawing period, the highest depletion of groundwater over a month-long freezing period was merely 25.3mm (sand gravel), whereas the highest depletion of groundwater over a month-long thawing period reached 113.3mm (find sand), indicating that the freezing-thawing period is an important period of recharge for groundwater.
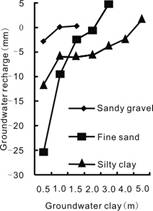
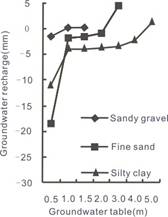
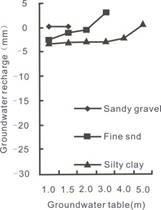
November December January
February March
Fig. 2 Amount of Groundwater Recharge of Different Lithologies in Different Months
4 Conclusions
The freezing-thawing period of inland basins in Northwest China lasts nearly five months. In this period, due to the impact of frozen soil and snow cover, the recharge and depletion of groundwater is significantly different from those in the non-freezing period. Thus, strengthening the observation and research on groundwater recharge in this particular period will enhance our understanding of the formation of groundwater resources in inland basins in Northwest China and improve the accuracy of the evaluation of groundwater resources. Tests and studies over the 1999-2000 period have allowed the author to come to the following conclusions:
(1) In the freezing period, for sand gravel, where the groundwater embedment depth was lower than 1m, groundwater primarily suffer depletion; for fine sand, where the groundwater embedment depth was lower than 3m, groundwater primarily suffer depletion; for silty light clay, where the groundwater embedment depth was lower than 5m, groundwater primarily suffer depletion as well. Under opposite conditions, groundwater primarily receives recharge. Areas with sand gravel and fine sand are favorable for the protection of shallowly-embedded groundwater resources.
(2) In the thawing period, regardless of the groundwater embedment depth, groundwater of sand gravel, fine sand and silty light clay all receive recharge from thawing water (including thawing water from snow cover and frozen soil layer), but the recharge of groundwater of fine particle lithology is small and has a lagging effect. In contrast, coarse particle lithology is more favorable for the formation of groundwater resources.
(3) In the entire freezing-thawing period, the highest depletion of groundwater over a month-long freezing period is not larger than 25.3mm (sand gravel) whereas in the thawing period, the highest recharge of groundwater over a month-long period reaches 113.3mm (fine sand). The thawing period is an important period of recharge for groundwater during the year.
Reference:
[1] Zhanrong Guo, Huatai Liu, Enchun Jing. Research on the Conversion Relationship between Phreatic Water and Soil Water in Inland Basins in Northwest China. Hydrology, 2002, 22(2):1-5.
[2] Zhanrong Guo, Enchun Jing, Zhenlong Nie. Analysis of the Characteristics of Soil Moisture Transfer in the Freezing and Thawing Periods. Advancement of Hydroscience, 2002, 13 (3): 298-302.


