Evolutional Rules of Regional Groundwater System
HYDROGEOLOGICAL MONITORING ACROSS A GROUNDWATER DIVIDE,NORTH DUBLIN, IRELAND
F. COLLINS, S. HERLIHY
RPS Group, Ground Floor, Block 2, West Pier Business Campus, Dun Laoghaire, Co
Abstract: A regional waste facility is required for the
Key words: risk assessment; landfill; fractured bedrock; diffuse recharge; Bog of the Ring; sustainable development
1 I 1 Introduction
The local authorities in the Dublin region are planning a regional waste facility for the
2 2 Background
Extensive hydrogeological investigations were undertaken during the 1980’s and 1990’s to develop a groundwater source for an area of North County Dublin. The investigations included trial well drilling and culminated in a pilot scheme and environmental monitoring programme for the development of a locally important aquifer. This pilot scheme is located at the Bog of the Ring (BOTR) and abstracts an average combined yield of 4ML/day from four pumping wells within fractured limestone bedrock. Refer to Figure 2.
A siting study for a regional waste facility identified a preferred landfill site over 2km south of the BOTR (Figure 2) in an area currently under agricultural land use. During 2005, detailed hydrogeological investigations were carried out at the site and in the wider study area to confirm its suitability for the location of a landfill. Hydrogeological monitoring is ongoing. This paper presents the results of the detailed hydrogeological investigations in particular in relation to the determining the possibility of a hydrogeological connection with the public supply scheme to the north. The results are presented in the context of regional hydrogeological studies previously undertaken.
3 Climates and Topography
The North Dublin area has a temperate maritime climate. Meteorological (Met) records at
The topography within a 3km radius of the proposed landfill is gently sloping following the underlying structural trend of west-northwest (WNW) to east-southeast (ESE) with an approximate elevation ranging from 70 metres above Ordnance Datum (m AOD) to 30m AOD from northwest to south east. Regionally, highs of 176m AOD and 94m AOD occur further north-west and north east of the proposed landfill site.
The relatively high stream density which follows the same WNW-ENE trend along the topographical slope drains the higher ground to the west. (Figure 2). The high stream density is an indicator of underlying poor draining soils with a high clay content.
4 Regional Geological Setting
The proposed landfill site lies within a basinal setting on the southern limb of a syncline within the
The structural geology is dominated by the North Dublin fault which lies to the north of the BoTR and which displaces older Lower Palaeozoic Rocks against the younger Carboniferous Loughshinny Formation. This west-northwest to east-southeast (WNW-ESE) trending fault zone is not a continuous line, but is cross-cut and offset by roughly north-south (N-S) faults that also cut across the younger limestones and Namurian rocks. One of these N-S faults extends southwards in a line to the east of the proposed landfill site. Geological cross sections depicting the underlying geology of the area are shown on Figure 4.
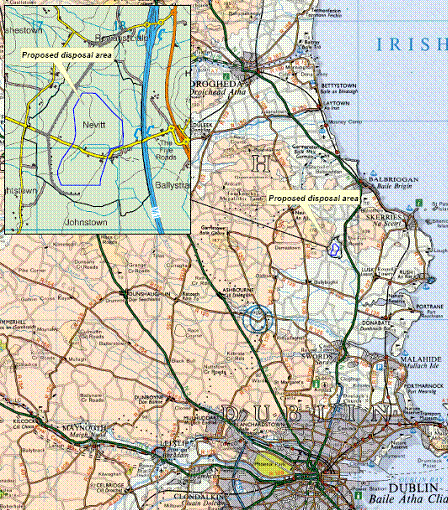
Figure 1: Location Map
The subsoils of the North County Dublin area have been mapped by Teagasc (2004) as being largely glacial till derived from shales and sandstones with a high (>70%) clay or silt/clay content. Much of the area is covered by these thick subsoils. Exceptions are typically on higher ground where rock is close to the surface. The previous studies undertaken at the BOTR identified significant (5m to 12m) gravel deposits overlying bedrock and beneath the clayey tills (GSI,2005). Peat deposits (up to 0.5m) are also found overlying thick clays in the BoTR area (KT Cullen & Co., 2000). The Bog supports birds, flora and fauna and has been designated as a Natural Heritage Area under Irish Law. Evidence to date indicates that the bog is largely rainwater fed. The bog may have had a groundwater input formerly with local drainage reducing that input.
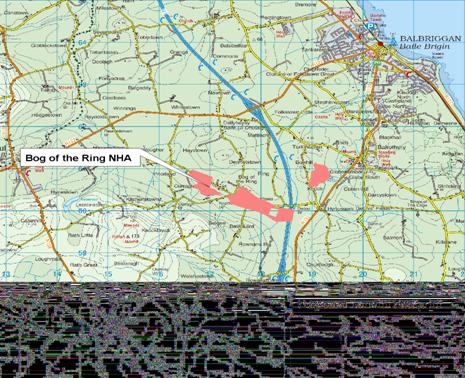
Figure 2: Site Location
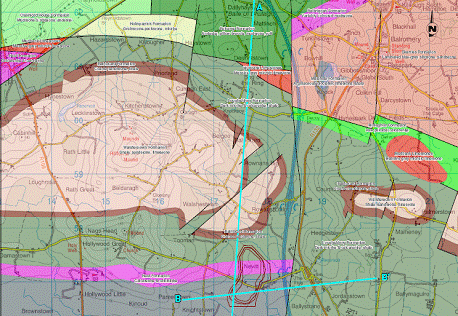
Figure 3: Bedrock Geology
Table 1 Geological Succession (GSI, 2001).
|
Geological Formation |
Lithology |
Age |
Maximum Thickness (m) | |
|
Walshestown (WL) |
Shale, sandstone and limestone |
Carboniferous |
Upr (Dinantian-Namurian) |
>200 |
|
Balrickard (BC) |
Coarse sandstone and shale |
75-100 | ||
|
Mullaghfin (MF) |
Coarse grained limestone |
Lower (Dinantian) |
210 | |
|
Holmpatrick (HO) |
Coarse to fine grained limestone |
80-90 | ||
|
Loughshinny (LO) |
Dark micrite and calcarenite, shale |
100-150 | ||
|
Naul (NA) |
Calcarenite & Calcisiltite |
>100 | ||
|
Lucan1 (LU) |
Dark limestone & shale |
800 | ||
|
Malahide (ML) |
Muddy and fossilferous limestone |
300-1200 | ||
|
Mudbank Limestone (MK) |
Fine grained limestone |
? | ||
|
Denhamstown (DD) |
Greywacke sandstone and siltstone |
Lower Palaeozoic (Silurian/Ordovician) |
? | |
|
Skerries (SS) |
Laminated blue-grey siltstone |
>350 | ||
|
Balbriggan (GG) |
Variably coloured mudstone |
~500 | ||
|
Belcamp (BP) |
Volcanics: andesite; pillow breccia; tuff; and mudstone |
>1,600 | ||
|
Clashford (CF) |
Mudstone and siltstone; andesite |
>100 | ||
|
Herbertstown (HB) |
Andesite, tuff and mudstone |
>300 | ||
|
Snowtown (SW) |
Banded grey mudstone and siltstone |
200 | ||
|
Fourknocks (FK) |
Banded red & green mudstone & siltstone |
? | ||
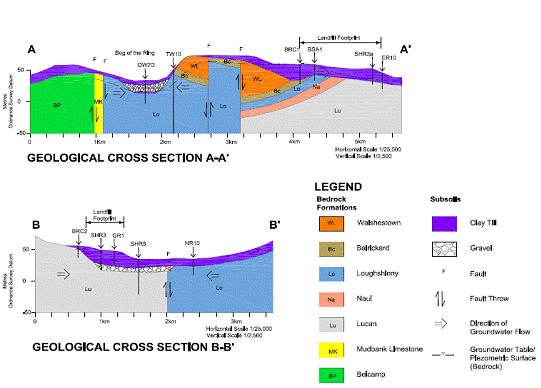
Figure 4: Geological Cross Sections
5 Regional hydrogeological setting
Groundwater flow within bedrock has been determined by regional studies to be primarily along faults and fractures in the bedrock, evidenced by discrete inflow zones recorded in well logs. Dolomitized zones may exist, further enhancing permeability (GSI,2005). Dissolution of the limestone along fracture planes is expected to further increase permeability.
The Geological Survey of Ireland (GSI) have classified the bedrock in terms of its aquifer potential. Similarly, as part of the work being carried out for the implementation of the Water Framework Directive (2000/60/EC), the Eastern River Basin District (ERBD) project team are delineating groundwater bodies for the region. A review of the various datasets determines that the majority of the region is underlain by a locally important, generally moderately productive, bedrock aquifer (Lm). Small areas of locally important karstified aquifer (Lk) occur at the BoTR along the North Dublin Fault. Poor aquifers underlie the higher ground to the northwest and north of the North Dublin Fault. The Lm and Lk aquifers are part of the Lusk-BoTR groundwater body which underlies most of the area. This groundwater body has been categorised by the ERBD as being ‘probably at significant risk’ from ‘potential overabstraction’. The poor aquifers to the northwest are designated as the Hynestown groundwater body.
Transmissivity and storativity within the Lusk groundwater body are regarded as being better than normal for the Calp Limestone (Lucan formation). Typical transmissivities of between 130 and 290m2/day were obtained during pumping tests in the Loughshinny Formation (KT Cullen, 2000) during hydrogeological investigations in the Bog of the Ring area. However transmissivity values as high as 580m2/day were obtained, which may be due to the presence of thick gravels in that area.
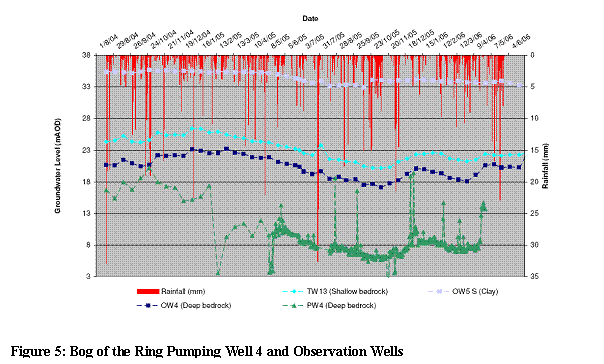
The BOTR public water supply abstracts groundwater from the Loughshinny formation/Lusk-BoTR aquifer at a rate of 4 ML/day from four pumping wells. Hydrographs from the pumping wells and observation wells indicate that the regional water table is in long term decline and has not reached a steady state (refer Figure 5). This is consistent with the ERBD findings that the aquifer is ‘at risk from potential over abstraction’. However, 2005 was an exceptionally dry year so it cannot be ruled out that the effect is seasonal. The aquifer is confined at this at this location.
 Groundwater in the Lusk-Bog of the Ring groundwater body is classed as a hard, calcium bicarbonate type water. The water abstracted at the BOTR is generally of good quality apart from the presence of naturally occurring iron and manganese. The water is chlorinated prior to use. Water is supplied to a number of private wells in the area largely for gardens and market garden irrigation. Faecal coliform bacteria has been detected in some of these wells as has potassium, chloride, orthophosphate and manganese at levels above the EPA interim guidelines and in some instances above the drinking water standards. The possible source of pollution is suspected to be from septic tanks and/or agricultural sources. The ERBD has designated the groundwater body that supplies the Bog of the Ring as category ‘1b - probably at significant risk’ from ‘diffuse source pollution’, likely to be a result of nutrient loss from agricultural practices (ERBD, 2004). In terms of point source pollution the groundwater body is currently designated as ‘2b - not at significant risk’. The Hynestown groundwater body is assigned the same risk categories with respect to pollution.
Potential recharge in the North County Dublin area has been estimated at 358mm/yr (GSI, 2005) based on average annual rainfall for the period 1971-2000 and from Met. Eireann average annual evapotranspiration data. The GSI studies undertaken at the BoTR estimated actual recharge to range from 0mm/yr (in artesian conditions) to a maximum of 322mm/yr where the subsoil is thin (<3m) or absent. Over most of the area the recharge is estimated to be approximately 57mm/yr (GSI, 2005). This equates to 18% of the potential.
Groundwater discharges from the Lusk Groundwater Body via baseflow to streams; as springs and at abstractions via wells, notably the Bog of the Ring Public Water Supply. The main discharges are to the north and southeast. Field observations of dry weather flows at end of July 2006 after following a sustained dry period suggest that there is a very small component of groundwater baseflow to the streams draining the site.
Due to the presence of thick low permeability clays the aquifer is largely confined except in local areas where subsoils thin and bedrock outcrops.
Pumping tests at the BoTR concluded that the gravels which overlie bedrock have been proven to be important for providing additional storage and transmissivity to the aquifer.
The clay subsoils overlying the bedrock and gravel deposits are generally considered to be non- aquifers.These low permeability subsoils inhibit recharge but provide good aquifer protection as well as acting as a confining layer. Exceptions are typically on higher ground where rock is close to the surface and along stream beds.
6 Field investigations
To ascertain the site suitability for landfill and in order to map the groundwater table in the underlying aquifer, a detailed ground investigation has been conducted within a radius of 3km of the landfill area involving drilling of rotary and cored boreholes into bedrock; shell and auger boreholes in the overburden, trial pitting, in-situ testing of soils and the installation of a groundwater monitoring network at 93 locations. The investigation provides information on overburden type and thicknesses, extent of made ground, depth to bedrock, bedrock type and degree of fracturing.
Monitoring wells were installed within four separate horizons: deeper bedrock (up to 35m into bedrock); shallower bedrock (10m into bedrock); local significant (>3m) saturated gravels overlying bedrock; and clay. The wells are monitored for groundwater level variations using automated dataloggers validated by manual measurements. The monitoring network in the immediate vicinity of the landfill footprint is shown on Figure 6 but it extends further north towards the Bog of the Ring. Baseline water quality is also being established.
Permeability (falling and rising) head tests were undertaken within the subsoil deposits within selected boreholes. Laboratory permeability testing of subsoils was also undertaken. Single and double packer permeability tests were completed within bedrock at key cored borehole locations. In addition, a series of pumping tests were carried out within four wells in the landfill study area: three within bedrock and one within the gravel deposits.
7 Results
The field investigations verified that the subsoil within the study area is dominated by glacial till deposits described as sandy gravely CLAY. Sand and gravel underlying the till locally. The till was found to have two distinct layers: Total clay thickness varied from approx 3m to 30m but was typically 15m to 25m. In the proposed landfill footprint the clay extended to depths ranging from 20mbgl to 27.25mbgl, resulting in a low vulnerability classification for the aquifer.
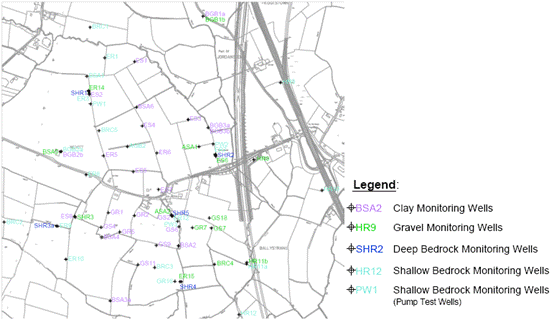
Figure 6 Groundwater monitoring network: main landfill study area
Groundwater monitoring well hydrographs for the site indicate natural fluctuations in groundwater level across the study area ranging from 0.04-1.6m. Where the clay thickness is significant there is no significant response to rainfall. This is demonstrated in Figure 7 (ER14 north) where the subsoil, described as boulder clay with occasional cobbles, is 21.8m thick.
Where the aquifer is overlain by thin subsoils, a response to rainfall is observed. This is demonstrated on Figure 8 at BRC2 (bedrock well in west) where the clay thickness is 4.5m.
The final landfill is designed to be underlain by a minimum 10m thickness of natural clay in addition to the requirements of the EPA for engineered lining. Figure 9 shows an area where there is currently approximately just under 10m (9.3m) of clay cover. In this well there is a more subdued response to rainfall is visible.
An essential element of Water Framework Directive implementation is the estimation of diffuse recharge, required in order to estimate the quantitative status of groundwater bodies. Based on a recent publication (Fitzsimons and Misstear, April 2006), numerical modelling undertaken by the GSI and the expert judgement of several Irish hydrogeologists, recharge coefficients for the range of hydrogeological settings in
Vertical groundwater gradients between the overburden and the bedrock have been assessed and were found to vary across the site. In the northwest (SHR1) and central (SHR5) study area, groundwater levels in the clay are approximately 2m higher than those in the underlying bedrock indicating that there is a downward gradient between the clay subsoil and the bedrock at these locations (refer Figure 10). Further south (SHR4) there is approximately half a metre upwards head gradient between deeper bedrock and the shallower bedrock and gravel horizons. In the east, (SHR2) groundwater levels in the bedrock are 0.25m higher than in the overlying gravel subsoil, which suggests that there are vertical upwards hydraulic gradients between the bedrock and the subsoil at this location. At a nearby location, groundwater levels (at PW3 and GS6 show a similar pattern). Elsewhere, groundwater levels in the gravel along the north-south fault area are the same as in the bedrock indicating that there are no vertical hydraulic gradients between these two units in this area.
Aquifer characteristics were determined by a series of four pumping tests: three within pumping wells (PW1 to PW3) drilled approximately 10m into the bedrock aquifer in the north, central to south and in the east close to the north-south fault. A fourth pump test well (ASA2) was installed within the gravel deposits in the central/south area. The rational behind pumping tests in the shallow part of the aquifer was to determine the characteristics in that part of the aquifer which contaminants would reach first, in the event of leakage from the landfill. During the pumping test, monitoring was undertaken at all the levels: deep bedrock; shallow bedrock; gravel and clay. Pumping test rates varied from 56m3/day to 560m3/day in the bedrock aquifer and was 623m3/day in the gravel deposits.
The groundwater drawdown responses indicate that the gravel, shallow bedrock and deep bedrock horizons are connected hydrogeologically.
A response to pumping from the bedrock and gravel wells was recorded in the clay monitoring wells in some parts of the site. Where significant responses were measured they tended to occur along a north-south trend towards the fault line and were of the order of 0.25m to 0.75m drawdown at 100-200m distance. However other clay wells at similar or closer distances did not respond and there was no response in clay monitoring wells within the landfill footprint itself.
None of the boreholes installed to the north of the site (HR4, HR5, and BRC1) in the poor aquifer i.e. Hynestown Groundwater Body, responded to pumping.
Two observation wells close to the Bog of the Ring were monitored during the pumping tests undertaken in the Fingal Landfill study area to confirm previous pumping tests which had determined that groundwater at Bog of the Ring is not connected to the aquifer underlying the landfill. Data loggers were installed within OW6 and TW10. Both monitoring wells are installed within the limestone bedrock. There were no significant changes in water level at two wells monitored in the BoTR network during the six week pumping test period, indicating this area was unaffected by pump testing in the study area (Refer Figure 11).
Transmissivity values obtained for bedrock were in the range 10 to 76 m2/day. The lowest values were found in the northwest footprint and the highest values obtained close the major North-South trending fault. Intermediate values were obtained to the southwest. Transmissivity within the gravel aquifer were higher and ranged from 71 to 86m2/day.
Overall, the Transmissivity values obtained are low to moderate. This is consistent with the GSI aquifer classification, i.e. a locally important bedrock aquifer which is ‘generally moderately productive’ (Lm). The transmissivities obtained were generally significantly lower than those found within the Bog of the Ring groundwater body as reported by GSI, 2005.
Storativity values for the bedrock are relatively low (1.9-04 to 3.2E-03) which is to be expected from a confined aquifer in which both the aquifer matrix and water are compressed. Similarly, the response zone during the pumping tests is widespread, with a cone of depression extending to beyond 300m, as is the expected behaviour of a confined aquifer. The storativity of the gravel was estimated to be 1.7 E-04 .
Groundwater beneath the site is a calcium bicarbonate rich water as would be expected from a limestone aquifer and calcareous bedrock. The presence of ammoniacal nitrogen (0.2-0.9mg/l), ortho-phosphate (up to 2.91 mg/l) and sulphate (up to 533 mg/L) above the Drinking Water Standard (98/83/EC) in some wells indicate that despite the widespread low vulnerability classification in the study area, groundwater shows evidence of impacts from human activities. This is likely to be a result of input from areas of higher vulnerability up-gradient where recharge is greater, which then flowed down-gradient within the aquifer. This is consistent with the ERBD classification of the aquifer being ‘probably at risk from diffuse source pollution’
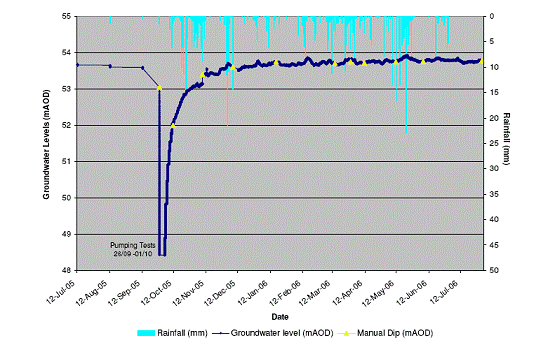
Figure 7: ER14 Hydrograph (>20m Clay Cover)
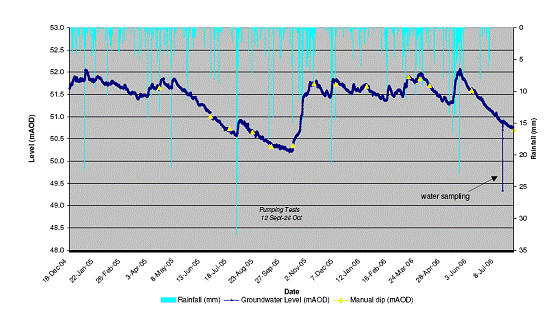
Figure 8: BRC2 Hydrograph (<5m Clay Cover)
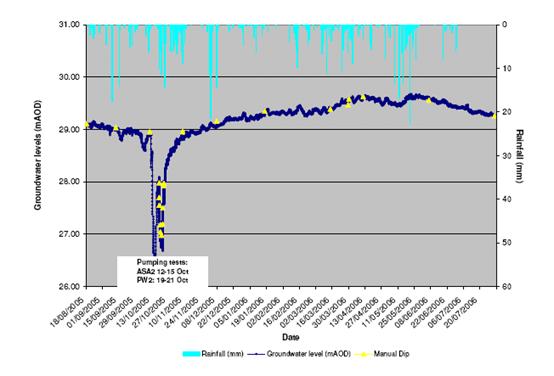
Figure 9: ES6 Hydrograph (9.3m clay cover)
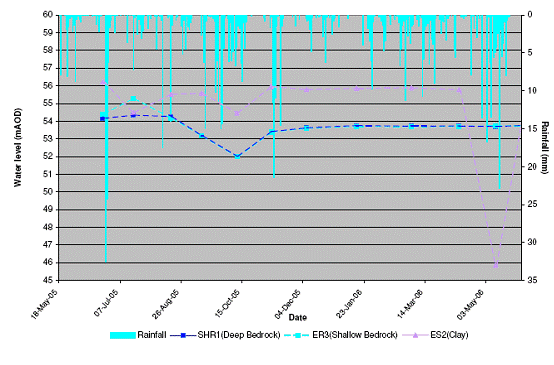
Figure 10: Hydrograph of SHR1 Area (manual data)
Table 2 Recharge coefficients for different hydrogeological settings
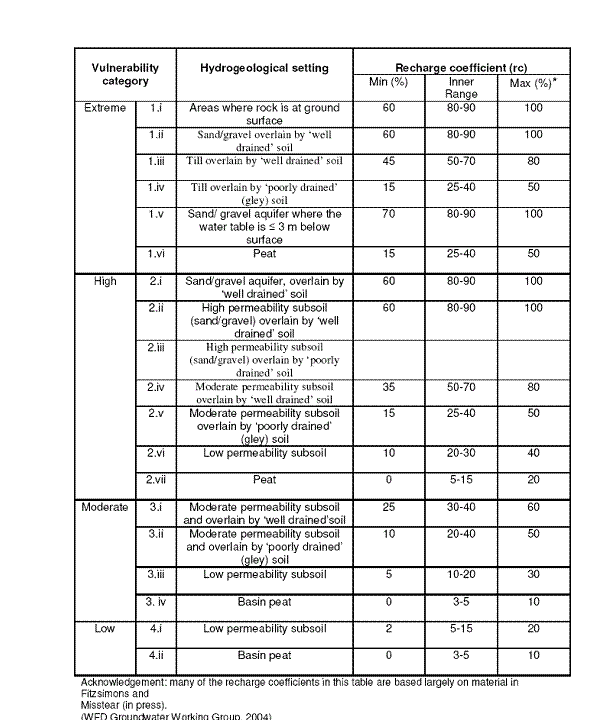
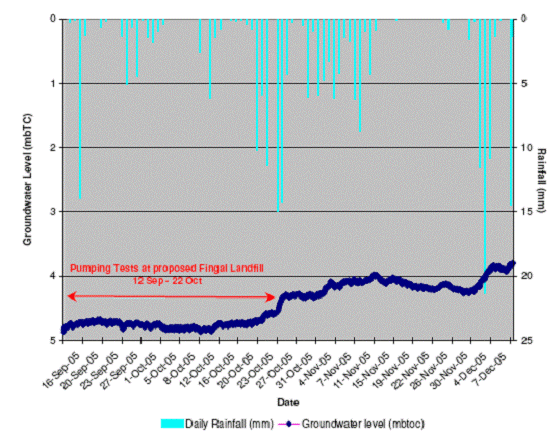
Figure 11: OW6D Hydrograph
Arsenic, a naturally occurring metal, also exceed the guidelines, (11-21mg/L in one upgradient and one downgradient well. Iron and manganese were also detected at concentrations which reached up to 2.8mg/L.
Groundwater flow maps were produced on a monthly basis since June 2005. A typical groundwater flow contour map is shown on Figure 12.
Groundwater flows within the fractured bedrock beneath the landfill footprint in a south easterly direction. The overall groundwater gradient is 0.02. A groundwater divide is located to the northeast acting as a barrier to groundwater movement. Groundwater converges in this area from the higher ground to the east and west further diverging northwards to the BoTR wellfield and southwards, skirting the eastern edge of the proposed landfill footprint. The groundwater flow contours have not varied significantly and has consistently demonstrated that groundwater flow below the proposed landfill site is away from the Bog of the Ring through summer, autumn, winter and spring. To the north of the groundwater divide, the cone of depression at the Bog of the Ring pumping wells can be seen to extend in a broadly WNW-ESE trend co-incident with the main fracturing along the North Dublin Fault. The cone is compressed from north to south, a result of lower permeability poor aquifers to the north of the North Dublin Fault and to the south (the Walshestown formation). It is concluded that there is no currently connection between groundwater below the proposed site and the Bog of the Ring water supply. Groundwater flow below the landfill footprint has been consistently mapped to flow in a south easterly direction.
The combination of the locally important aquifer designation and the low groundwater vulnerability classification results in an R1 classification in the Response Matrix for landfills developed by the Department of the Environment, the Environmental Protection Agency and the Geological Survey of Ireland (DoE, EPA, GSI 1999). This is the lowest classification in the response matrix and indicates that the site is acceptable for landfill subject to EPA guidance or conditions of a waste licence.
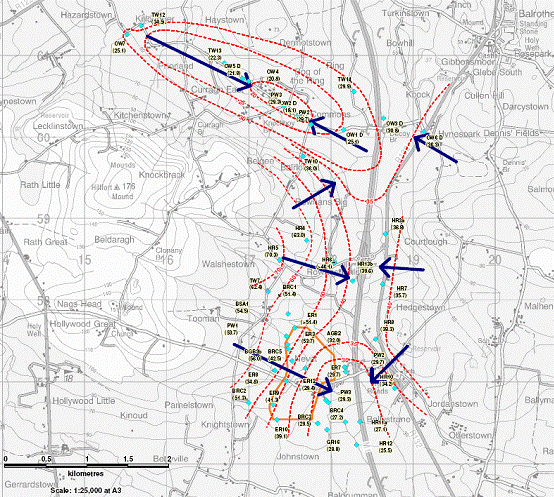
Figure 12: Bedrock Groundwater Flow Map (May 2006)
Table 3 Response Matrix for Landfills (DoEHLG/EPA/GSI, 1999)
|
VULNERABILITY RATING |
SOURCE PROTECTION AREA |
RESOURCE PROTECTION (Aquifer Category) | ||||||
|
Regionally Important (R) |
Locally Important (L) |
Poor Aquifers (P) | ||||||
|
Inner |
Outer |
Rk |
Rf/Rg |
Lm/Lg |
Ll |
Pl |
Pu | |
|
Extreme (E) |
R4 |
R4 |
R4 |
R4 |
R32 |
R22 |
R22 |
R21 |
|
High (H) |
R4 |
R4 |
R4 |
R4 |
R31 |
R21 |
R21 |
R1 |
|
Moderate (M) |
R4 |
R4 |
R4 |
R31 |
R22 |
R21 |
R21 |
R1 |
|
Low (L) |
R4 |
R31 |
R31 |
R31 |
R1 |
R1 |
R1 |
R1 |
8 Discussion
The proposed landfill footprint has been sited in an area of low recharge where diffuse recharge predominates and where natural groundwater protection is correspondingly high.
The investigation identified a groundwater divide north of the proposed landfill site within the bedrock aquifer that was consistent with the surface hydrological catchments of the area and with the findings of the GSI studies (2005). The divide was found not to vary significantly throughout the year.
At current abstraction rates the public water supply to the north would not be impacted by the proposed development. Combined with the locally important aquifer classification, this locates the site in a category which would be acceptable for the location of regional waste facility according to the national guidelines
(EPA/GSI/DoEHLG, 1999). At present it is uncertain whether there is potential to develop this locally important aquifer further. Irrespective of this, a land use decision will be made based on sustainable development principles which considers the regions water use and waste management needs.
Acknowledgements
We wish to thank Fingal County Council for allowing this paper to be presented to the IAH International Congress. Thanks also to Donal Daly, Natalya Hunter Williams and Geoff Wright of the Geological Survey of Ireland and to Henning Moe from the Eastern River Basin District Project Team for our discussions.
References
[1] Daly, D, 2004. John Jackson Lecture 2004. Making geology relevant to the people of
[2] Department of the Environment and Local Government (DoELG), Environment Protection Agency (EPA) and Geological Survey of
[3] Eastern River Basin District (ERBD) Project Website – www.erbd.ie;
[4] ERBD, 2004. Final Initial Characterisation Report , Section 9 Groundwater;
[5] ERBD, Summary of Initial Characterisation Report;
[6] ERBD, 2004. Synthesis Report for
[7] ERBD, 2004. Groundwater Progress Report – September 2004;
[8] GSI, 1999. Geology of Meath, Sheet 13. Scale 1:100,000 (1999);
[9] GSI, 2001. Geology of Meath. A Geological Description to accompany the Bedrock Geology 1:100,000 Scale Map Series, Sheet 13;
[10] GSI, 2003. (DRAFT) GSI Guidelines for Assessment and Mapping of Groundwater Vulnerability to Contamination;
[11] GSI, 2005. Bog of the Ring Groundwater Source Protection Zones. Prepared on behalf of Fingal County Council;
[12] K.T. Cullen and Co. Ltd., January 2000. Environmental Monitoring Programme Bog of the Ring;
[13] K.T. Cullen and Co. Ltd., June 1994. Report on Hydrogeological Investigation at the Bog of the Ring. North County
[14] K.T. Cullen and Co. Ltd., 2000. Bog of the Ring Groundwater Development Drilling and Testing Programme;
[15] Fitzsimons, V.P. and Misstear, B.D.R., 2006. Estimating groundwater recharge through tills: a sensitivity analysis of soil moisture budgets and till properties in
[16] P.H. McCarthy & Partners, August 2004. Bog of the Ring Groundwater Development – Report on Hydrogeological Investigations and Proposals for the short term development of the aquifer;
[17] P.H. McCarthy & Partners, August 1994. Bog of the Ring Groundwater Development – Report on Hydrogeological Investigations and Proposals for the short term development of the aquifer;
[18] P.H. McCarthy & Partners (not dated). Bog of the Ring Stage 1-Contract 2 Water Treatment Plant and Groundwater Extraction Volume 5 Existing Data;
[19] Teagasc, 2004. Subsoil Map;
[20] White Young Green (WYG), October 2003. Bog of the Ring Monitoring Programme 2003 Report Reference No. C002764/1;
[21] WYG, December 2003. Bog of the Ring Interim Report;
[22] WYG, May 2004. Monitoring Programme Bog of the Ring Final Report;
[23] WYG, February 2004. Monitoring Programme Bog of the Ring Interim Report.


