


Achievements
IDENTIFYING SOURCES AND MECHANISM OF GROUNDWATER RECHARGE IN THE CAPE FLATS, SOUTH AFRICA: IMPLICATIONS FOR SUSTAINABLE RESOURCE MANAGEMENT
*Adelana M.A.
Segun1, Xu Yongxin2 & Adams Shafick3
1 Earth Sciences
Dept., University of the Western Cape, Bellville 7535, South Africa. (e-mail:
sadelana@uwc.ac.za)
2 Earth Sciences
Dept., University of the Western Cape, Bellville 7535, South Africa. (e-mail:
yxu@uwc.ac.za)
3 Earth
Sciences Dept., University of the Western Cape, Bellville 7535, South
Africa. (e-mail: shadams@uwc.ac.za)
* Corresponding
author
Abstract: The Cape Flats represents
a region of broad coastal sand between the Cape Peninsula and
the mainland. The sand covers an area of approximately 630 km2,
extending in a northerly direction along the west coast. It is a
highly productive area with intense water use and with multi-stakeholder
interest in water. Due to the location of springs close to the urban centre the
water resource system here has high community and aesthetic values. Therefore,
to properly manage groundwater resources, in relation with the available
surface sources, accurate information about the inputs (recharge) and outputs
(natural discharge and pumpage) within the groundwater basin is needed so
that the long-term behaviour of the aquifer and its sustainable yield
can be estimated or reassessed. To assist in this effort, a study of this
nature was undertaken to compile and reassess the various recharge estimates
for the Cape Flats aquifer in the Western Cape of South Africa.
This study provides some highlights and attempts to elucidate the path towards
sustainable use of groundwater in the region as a whole. Although the focus in
this research is on the Cape Flats aquifer, the results and
analysis presented are believed to be characteristic of the entire Coastal
Plain sands in the Western Cape. As a first step towards this effort, this
research work highlights some key groundwater recharge methods in the Cape area
at different scales, such as regional soil-water budget and groundwater modelling studies,
region-scale groundwater recharge studies on the TMG aquifer, as well as
field-experimental local studies, including some original new findings, with an
emphasis on assumptions and limitations as well as on environmental factors
affecting recharge processes.
Keywords: Soil-water
budgets, Groundwater recharge, Water management, Cape Flats aquifer, South
Africa
Introduction
Estimating recharge is essential in any analysis of groundwater systems
and the impacts of withdrawing water from the aquifer. Identification of all
the recharge mechanisms and the estimation of the magnitude of the different
components of recharge are now recognised as one of the most
important aspects of groundwater resource studies. In water resource
investigations, groundwater models are often used to simulate the flow of water
in aquifers, and, when calibrated, may be used to simulate the long-term behaviour of
an aquifer under various management scenarios. Better estimates of recharge and
its spatiotemporal distribution can increase the accuracy of ground-water-flow
models and contaminant transport (French et al. 1996) and predictions of water-level
trends. Thus, without a good estimate of recharge, the impacts of
withdrawing groundwater from an aquifer cannot be properly assessed, and the
long-term behaviour of an aquifer under various management schemes
cannot be reliably estimated (Sophocleous 2004).
In the Western Cape, agricultural sector is one of the largest users
of water resources. But rapid economic development and population growth is
generating increased pressure on water supplies; that may soon lead to greater
dependence on groundwater. The growth in urban water demand in the Greater Cape
Town Metropolitan Area was projected to increase from 243 million m3 in 1990
to 456 million m3 in 2010; whereas for irrigation water
demand the increase is from 56 million m3 in 1991 to 193
million m3 in 2010 (NINHAM SHAND 1994). The total urban
and irrigation demand was estimated at 470 million m3 in 1998
and is expected to reach 664 million m3 by 2010. Over 60% of
the annual urban demand and 90% of the irrigation demand occurs in summer.
Moreover, the shortage of surface water, which is fully used in the study area,
makes groundwater a potential source for development. Therefore, the shortage
of water resources could become a serious restraining factor for economic
development of the Western Cape if proper management schemes are not
in place. The most prominent and, may be, the less developed primary aquifer in
the Western Cape underlies most part of the metropolitan area of the City of
Cape Town and its suburbs. Due to the increasing tendency to develop and
exploit this aquifer for municipal water supply the knowledge of the recharge
rates and characteristics becomes a significant issue. Therefore, to properly
manage groundwater resources, in relation with the available surface sources,
accurate information about the inputs (recharge) and outputs (natural discharge
and pumpage) within the groundwater basin is needed so that the long-term behaviour of
the aquifer and its sustainable yield can be estimated or reassessed. To assist
in this effort, a study of this nature is being undertaken to compile and
reassess the various recharge estimates for the Cape Flats aquifer
in the Western Cape of South Africa. This paper provides some highlights and
attempts to elucidate the path towards sustainable use of groundwater in the
region as a whole.
Study Area Location and
Description
The Cape Flats falls within the region of the Western
Cape and belongs to a semi-arid climatic zone. It falls under the City of
Cape Town Water Management Area (CMA). Presently, most of the area underlain by
the Cape Flats aquifer is built up, from the City main bowl to
the northern and southern suburbs. The City of Cape Town is on the
western edge of the Cape Flats with part of the city and its
suburbs underlain by Cenozoic sands. The Cape Flats covers a
surface area of 630 km2 and is positioned between 33˚30΄
and 34˚10΄ south-latitude and between 18˚20΄ and 19˚00΄ east-longitude. According
to physiognomy and natural conditions, the Cape Flats is a
coastal plain sand and essentially lowland with the highest dune only at 65
m above sea level. The geographical location and general features of the
sand-covered coastal plain known as theCape Flats are shown in Figure
1. The Coastal Plain is composed of coarser grained materials, such as sand and
gravel, with areas dominated by silts and lenses of clay. Furthermore, being
flat and low-lying areas, the Cape Flats (like most Low Plains) is difficult to
drain, and could therefore lead to soil salinization, which decrease crop
yields and limits farming to salt-tolerant crops. The climate of Cape Town reveals
annual precipitation of the Cape Flats area varies between 400
and 500 mm, with an arid period from November to April, and that the mean
annual temperature is approximately 17˚ C. The Cape Flats area
is bordered to the north by a region characterized by an extremely low amount
of annual precipitation, decreasing from the interior to less than 250 mm along
the northern coast (Schalke 1973). Rainfall is often
insufficient to meet the water demand of crops in the whole growing period or
part of it and irrigation is therefore crucial for obtaining high yields.
The Cape Flats is within the sphere of the major catchments
within greater Cape Town area (Fig. 1), where runoff is mostly
generated in the mountain ranges in the southeast and the Table Mountain and CapePeninsula Mountains in
the southwest. Sandy lowlands with minimal runoff and a high
water-table extend over the central area. The drainage towards the south takes
place by the Eerste River and by the Zeekoevlei into
False Bay, whereas to the north the Salt River and Diep River flow
into Table Bay (Fig.1). A feature of the Western Cape is
the high river flow that is experienced during the winter (about 85% of the
total). Land use within the greater Cape Town consists of urban and peri-urban
areas, industry, farming (vineyards, fruit, vegetables, wheat and livestock),
forestry and nature conservation. Future land use analyses indicate that
residential land will increase by 25 % and business/commercial land by 125 %
(CCTM 2005). Residential areas vary in density, and are both formal and
informal. Informal settlements take the form of shacks and squatter camps,
although the city management strives to reduce this yearly with formal housing
units. The total population of the Cape Town area was estimated at
3.2 million in 2001, with the highest density occurring on theCape Flats.
The average population growth rate in 2001 was about 3 % per annum. However,
the impact of HIV/AIDS and tuberculosis is expected to reduce this growth rate
to 1.2 % in 2010 (CCTM 2005). Cape Townhas a strong and diverse economy
dominated by industry (textile and clothing, metal and steel, petroleum, glass)
and other activities like tourism and agriculture.
Figure 1: The Cape Metropolitan Area with major catchments and settlements over Cape Flats sands
Geology of the Cape Flats
Regional geology of the Western Cape reveal that flat low-lying areas
occur in three regions, namely the Cape Flats, the Sandveld region of
the West Coast, and the undulating landscape of the north-north-eastern parts
of the CMA. The first two are overlain by significant depths of Quaternary
calcareous sand while the third region undulating, north-north-eastern area of
the CMA is underlain primarily by shale. A variety of soil types occur. They
are generally nutrient rich, fertile and amenable to agriculture.
The large undulating sandy area connecting the hardrock of the Cape Peninsula with
the mainland is known in the literature as the Cape Flats (Schalke 1973). It
is a component of the ‘Late-Tertiary and Recent sands’ unit, which are in
places up to 50 m thick (i.e. below the present sea level). Although
this cover is rather thin in relation to its wide lateral extent, practically no
outcrops occur. On the Cape Flats (and along the coastal plain
between Cape Town and Saldanha) are essentially sediments of
Quaternary age that blankets the Neogene deposits (Theron et al.
1992).
The basement of the Cape Flats is composed of Precambrian
and Palaeozoic rocks belonging to the Cape granite, the Malmesbury Formation,
and the Table Mountain Sandstone (Schalke 1973, Malan 1987, Theronet
al. 1992). The Cape Flats is assumed to have been developed
after the closure of the ‘Cape Strait’, which at one time united False Bay
with Table Bay, by lowering of the sea-level and a probable rise of the
basement (Walker 1952, Schalke 1973). The sands are derived from two
sources: (1) weathering followed by deposition, under marine conditions, of the
quartzite and sandstones of the Malmesbury Formation and Table
Mountain Group; (2) the beaches in the areas, from where Aeolian sand was
deposited as dunes on the top of the marine sands. The marine sands
were deposited in accordance with the prevailing sea level and the sand body is
horizontally stratified with several lithostratigraphic units
identified (Theron et al. 1992). The process of sedimentation was
initiated in a shallow marine environment, subsequently progressing into
intermediate beach and wind-blown deposits, and finally to Aeolian and marshy
conditions, which led to the formation of peaty lenses in the sands. According
to Henzen (1973), portions of the area of the Cape Flats (particularly
along the False Bay coast between Muizenberg and Macassar)
are covered by calcareous sands and surface limestone deposits. Silcrete,
marine clays and bottom sediments of small inland vlei deposits also
occur sporadically (Hartnadyand Rogers 1990). The detailed geology of the Cape Flats has
been described in Henzen (1973) and the full description of the
various lithostratigraphic units presented in Theron et al.
(1992).
Hydrogeology
The general hydrogeology of the Cape Flats aquifer was
described by Henzen (1973) and Gerber (1976) as regionally
unconfined, although interbedded clay and peat layers produce
semi-confined conditions in places. The Cape Flats aquifer
pinches out against impermeable boundaries in the east, west and north while
the southern boundary is defined by the coastline extending along the False
Bay, between Muizenberg andMacassar. Aquifer permeability and
specific yield have been calculated on the basis of 20 major abstraction and
recovery tests (Gerber 1981). The aquifer sands are well sorted with
hydraulic conductivities of 30-40 m/d in the central area and 15-50 m/d in the
eastern portion (Gerber 1981). Specific yield range from 0.02 to 0.25 while transmissivity values
are from 50-650 m2/d but typical values between 200 and 350 m2/d.
The effective porosity was of the order of 0.10 to 0.12 but values of 0.25 are
found over large areas (Gerber 1981). Recharge volume in the study area is
approximately 3.6 x 10⁷ m3 per annum. The
groundwater flowpaths are generally west to southeast towards the
coastline, except for saline waters that tends to permeate landwards at the
periphery of the coast and estuarine shoreline. Actual evapotranspiration in
the study area after Turc’smethod (Domenico and Schwartz 1998),
is 491.7 mm/a while the other method based on White (1932) results in an
average of 119.6 mm/a. Potential evapotranspiration for
the study area has been estimated using the well known empirical formula of Thornthwaite & Mather (1957)
to be 836.3 mm/a and the monthly mean is 69.7 mm.
The Cape Flats aquifer is recharged principally from
precipitation within the basin. Precipitation data from 1841-2005 measured at
the Cape Town Astronomical Observatory were analyzed. The mean of yearly
rainfall over this period is 619 mm and variability of annual
distribution pattern illustrated with the mean of ten years (Figure 2). Annual
means of rainfall for other stations around Cape Town are as follows: SommersetWest
(576.1 mm), University of the Western Cape (414 mm), Kirstenbosch (1381.9
mm). The average values are tabulated in Table 1. Hydrographs
of precipitation, potential and actual evapotranspiration are shown
in Fig. 3. The monthly values of precipitation decrease in the same
direction except for Kirstenbosch, located at the foot of the mountains.
The annual difference can be attributed to local climatic differences. The
rainfall is largely controlled by topography although to the north of the Western
Cape, this climate regime grades into semi-desert whereas to the east the
climate becomes less seasonal and tends towards sub-tropical on the coast.
Table 1: Rainfall
stations within Cape Town Municipal used in this study
|
Station |
Latitude |
Longitude |
Altitude (m) |
Period of Observation |
No. of years |
Annual Rainfall (mm) |
||
|
Max. |
Min. |
Mean |
||||||
|
Cape Town(SAAO)* |
33.97 |
18.6 |
42 |
1841-2005 |
164 |
1037.7 |
229.4 |
619.1 |
|
SommersetWest |
34.15 |
18.85 |
10 |
1934-2005 |
71 |
1191.1 |
104.4 |
576.1 |
|
Kirstenbosch |
34.00 |
18.43 |
160 |
1914-2005 |
91 |
2295.9 |
893.6 |
1381.9 |
|
§UWC, Bellville |
33.93 |
18.62 |
42 |
2002-2005 |
4 |
662 |
393. |
414 |
*SAAO = South African Astronomical Observatory; §UWC
= University of the Western Cape (Test site)
Infiltration from rainfall is the main source of recharge to the aquifer.
The groundwater levels are deepest during the early March (average 4.8 m bgl)
and begin to rise during June/July. During July and August, the water levels
rise at a constant rate. This rise accelerates in August/September, and about
60% of the annual water level rise occurs within this month. There is little or
no rain from October to March accounting for <5% of the total annual
rainfall and makes no contribution to the groundwater recharge.
Figure 2:
Variability of annual rainfall in Cape Town from a long-term record
(1841-2005)
Figure 3: Average
monthly values of precipitation, potential and actual evapotranspiration in Cape
Town Airport (1933-2005)
Theory and Methods
There are a number of techniques used in groundwater recharge estimation.
Generally, these are divided into five categories, with a range of techniques
and variations within each category:
(1) Groundwater hydrograph methods. These methods infer recharge from
groundwater response to rainfall. In general, water tables need to be shallow
and hydrogeological parameters, mostly specific yield, are required
as input. Comparison between different land uses is possible with a well set-up piezometer network
and monitoring the difference over a number of years. A transect of piezometers can
be used to infer longer term recharge to the system.
(2) Soil tracer methods. These provide point estimates of mean annual
drainage. In general, water tables need to be deep. Comparison between
different land uses is possible provided there are long term land management
practices in adjacent areas. Possible soil tracers include artificially applied
tracers (e.g. bromide, tritium), tracers from historical events (e.g. tritium,
chlorine-36 from nuclear test fallout) and natural tracers such as chloride and
stable isotopes of water molecule. The type of tracer to be used depends mainly
on the recharge rates with artificial tracers being useful at rates of > 100
mm/year, bomb tracers at rates greater than10 mm/year and chloride over the
range.
(3) Soil physical techniques. This includes a range of techniques
such as lysimeters, neutron moisture meters, zero flux method, and
hydraulic gradient methods. At high recharge rates, lysimeters are
perhaps the most technique and while having been used in semi-arid and arid
environments successfully. Neutron moisture methods are used as part of water
balance techniques, including meteorological station and modeling. Zero flux
and hydraulic gradient methods are based on accurate determination of hydraulic
conductivity as a function of water content or pressure head, which is often
difficult to estimate (Sophocleous 1991).
(4) Groundwater tracer methods. These can be used to infer the mean
annual recharge to the groundwater system, as a whole, or parts of the aquifer.
The type of tracer depends on the mean residence time of the aquifer, i.e. the
recharge rate. The commonly used tracers are carbon-14, CFCs and tritium. These
should be part of a whole groundwater study that includes hydrogeological investigations
and full hydrochemicalanalyses (Walker et al. 2002).
(5) Modelling techniques. Modelling generally augments
other techniques and can not be used by itself to estimate recharge. Simply,
there are too many parameters involved in this process. In some cases there may
not be enough previous measurements to constrain the modelling. Modelling techniques
are widely varied including water balance modelling, crop modelling and
groundwater modelling (Morgan & Henrion 1990, Bekesi& McConchei 1999).
According to Walker et al. (2002), having varied techniques available, the
best technique to use depends on a number of factors. These include: spatial
scale of interest, time scale of interest, magnitude of the recharge, accuracy
required, cost and access to facilities, time lags associated with processes,
whether variability is required and whether predictions of impacts are
required. In South Africa the methods previously applied have been
summarized in a schematic presentation (Bredenkamp et al. 1995, Xu & Beekman 2003)
to provide a logical structure and have been grouped into categories relating
to the following:
(i) The unsaturated zone which includes lysimeters studies, soil
moisture flow and balances, use of tritium profiles, chloride profiles in the
soil overlying an aquifer.
(ii) The saturated zone which includes an analysis of groundwater
hydrographs, water balances of delineated aquifers, the analysis of spring
flow, the saturated volume fluctuation method, and the cumulative rainfall
departure method (CRD).
(iii) Modelling of groundwater flow and the water balance,
incorporating the determination of recharge, storativity and transmissivity by
inverse solution techniques, the direct parameter estimation method involving a
multiple linear regression (inverse) fit of water balance parameters,
hydrological models based on conceptual hydrological interrelationships.
(iv) Steady state flow
approximations which involves applying Darcy’s law, incorporating the flow
through a cross-section of the aquifer.
(v) Rainfall-recharge relationship expressed by a regression type
simulation of the groundwater recharge in accordance with some conceptual logic
built into the formulae.
(vi) Natural radioisotopes
used to reveal mixing and transient flow within an aquifer system.
(vii) Natural stable isotopes
such as 18O and 2H are commonly used to reveal
groundwater characteristics and to distinguish between waters of different
origin.
The most important recharge studies carried out in South Africa have
indicated the essentials of different methods of analyzing a groundwater
system. Recharge estimates (by whatever methods) are normally subject to large
uncertainties and errors (Simmers 1988). In addition, the determination of
recharge variability in space and time is often high and can create a number of
unresolved problems or requiring additional investigations (Sophocleous 1991).
The various techniques applied in the quantification of recharge estimates for
the study area are discussed in the following subsections.
Water-table
Recharge
Water table recharge, often referred to by many
authors as water-table fluctuation (WTF) method (Gerhart 1986, Healy &
Cook 2002), is based on the premise that rises in groundwater levels in an
unconfined aquifer is due to recharging water arriving at the water table. The
spatial and temporal variations in the water table have been established from
regular head measurements over a two-year period and analysis of a 6-day rain
event in the study area. Typical response time between rainfall periods and
water table rise is 3-4 days, with rising limbs on hydrographs showing
increases of 3-15 cm (Fig. 4). Overall, the trend in hydrograph patterns
in the Cape Flats aquifer is very similar, and this has been
attributed to the high degree of connectivity between the sand bodies. Water
levels within the Cape Flats aquifer show an immediate and marked response to
rainfall (typically >30 cm rise within a week), as well as gradual
decreases (0.1-1.0 m) associated with longer periods (2-4 months) of little
or no rain. Between 30 March and 7 April, 1979 there was a
pronounced 13 mm rise in the water table and up to 40 mm after
recharge events (between 21 March and 21 June). However, between June and
September only a rise of 6 mm was recorded. The falling limbs may
sometimes take 2-4 months to return to initial levels; perched water bodies
were a common occurrence after rain events in places.
Recharge in this way is calculated using the following relationship:
R = Sydh/dt = Sy∆h/∆t
where Sy is specific yield, h is water-table
height, and t is time.
This method has been applied in several previous
studies (Meinzer & Sterns 1929, Rasmussen & Andreasen 1959, Gerhart 1986,
Healy & Cook 2002, Xu & Beekman 2003) and the
conclusion is that it’s best applied over short period (say, of few hours or
days) in regions having shallow water tables that display sharp rises and
declines in water levels. Ideally, water-level fluctuations occur in response
to spatially averaged recharge (Scanlon et al. 2002). Hence, this method can
also be applied over longer period or time intervals (either seasonal or
annual) to produce an estimate of change in groundwater storage, sometimes
referred to as “net” recharge (Healy and Cook 2002). In order to achieve this,
∆h is set equal to the difference between the peak of the water level rise and
the low point of the extrapolated antecedent recession curve at the time of the
peak. According to Healy and Cook (2002) the antecedent recession
curve is the trace that the well hydrograph would have followed in the absence
of the rise-producing precipitation.
Figure 4(a):
Hydrograph for monitoring wells DC182, DC183, DC184 with average monthly
precipitation

Figure 4(b):
Hydrograph for monitoring well BA081 with average monthly precipitation

Figure 4©: Hydrograph
for monitoring well BA083 with average monthly precipitation
Figure 5: Hydrograph of average water level in a borehole and bar graph
of weekly rainfall in the study area
A consistent static water level measurement on
6-hourly basis of a well in the study area, with longer record, was averaged
weekly and used to plot the water level hydrograph in (fig. 5). The figure
shows the average water level in a borehole (BA80) and total rainfall on a
weekly basis for April 21, 1979 through March 21, 1981. Water levels are
highest in late winter and early spring. Precipitation was not evenly
distributed even though rainfall occurrence was almost nearly weekly. Recharge
was calculated on a monthly basis using the above equation. As described
previously, Sy was estimated to be 0.26 for the study area
(Gerber 1976) while ∆h was taken as the cumulative rise in water level for each
month (i.e. the sum of all rises that occurred). In order to account for
drainage from the water table that takes place during the rises in water
levels, water level prior to each rise was extrapolated to the expected
position had there been no rainfall event. The rise was then estimated as the
difference between the peak level and the extrapolated antecedent level at the
time of the peak. The results of the monthly estimates of groundwater recharge
for the period March 1979 through February 1981 are shown in Table 2. The water
level and rainfall for this site (BA80) was looked into more closely using the
daily record. Figure 7a shows rainfall and depth to water table for
22 days during August and September 1979.
Table 2: Monthly change in water level and estimated groundwater
recharge for the study area (March 1979-February 1981)
|
Month |
Change in water level, ∆H (cm) |
Groundwater recharge, R (cm) |
|
1979 |
|
|
|
26.0 |
6.8 |
|
|
May |
15.0 |
3.9 |
|
June |
31.0 |
8.1 |
|
July |
21.0 |
5.5 |
|
August |
19.0 |
4.9 |
|
September |
29.0 |
7.5 |
|
October |
27.4 |
7.1 |
|
November |
28.8 |
7.5 |
|
December |
39.9 |
10.4 |
|
1980 |
|
|
|
January |
31.0 |
8.1 |
|
February |
30.5 |
7.9 |
|
March |
31.0 |
8.1 |
|
April |
17.5 |
4.6 |
|
May |
4.0 |
1.0 |
|
June |
9.0 |
2.3 |
|
July |
4.0 |
1.0 |
|
August |
26.8 |
7.0 |
|
September |
30.5 |
7.9 |
|
October |
0.0 |
0.0 |
|
November |
11.5 |
3.0 |
|
December |
6.0 |
1.6 |
|
1981 |
|
|
|
January |
9.0 |
2.3 |
|
February |
4.8 |
1.2 |
|
March |
9.0 |
2.3 |
Figure 6a: Rainfall and depth to water table for 22 days during
August and September 1979.
Figure 6b:
Rainfall and water-level at the same site for parts of July and August 1980.
Figure 6 (a & b) shows rainfall and depth to water table for two successive rainy seasons
in site BA80. The water level is in decline for the most of the period,
with the exception of a sharp rise that occurred on 23 August in response to
less than 2 cm of rainfall. The difference between the peak and the
trace of the recession curve is about 0.32 metres. Using the same approach
described above recharge for the 6-day period is then estimated to be 0.25
m, which is close to 50% of the total amount of rainfall. The shallower water
table and permeable sediments all contributed to the rapid water-level rise at
this site. All of the water arriving at the water table this time probably went
into storage, at least for a short period of time. Because the rise in the
first few days (in Fig 6a) was long and gradual, some water arriving at
the water table was likely lost toevapotranspiration or baseflow prior
to the time of water level. These losses would not be reflected in the
estimated recharge rate. The longer rainless
days before each rain event, the higher contribution to rising water
level. But, each rain event does not contribute to the same ratio of
the rising water level for a precipitation.
The effective infiltration rate of rain would
depend upon several factors such as no rainy days before a rain event, density
of rains fall, and precipitation amount as well as the size of reservoir. The
expected recharge rate from groundwater level fluctuation could be about 9%
based on the slope of the relationship on the figure 7 according to the Bredenkamp (1990)
as follow:
RE=r(Py-My) (1)
Where, RE is annual recharge, r is annual recharge
rate and Py and My are annual
precipitation and threshold rainfall, respectively.
Figure 7: The relationship between changed groundwater level and
precipitation of each rain event.
Recharge From Stream
Hydrograph
Groundwater and surface water in South Africa have been
perceived and managed as isolated resources. There is, however, a growing
recognition that rivers can receive groundwater from underlying aquifers, and
this can have significant implications for river quantity and quality. The
analysis of groundwater inputs into streams is critical when dealing with
issues such as reliability of water supply, water allocation, design of
water storages, ecosystem water requirements, contamination impacts or
predicting peak stream salinities. Hence, the method of stream flow
hydrograph analysis used by Meyboon (1961) and Fetters (1994) was
adapted in the study area to differentiate among the various components of
stream runoff and also to obtain quantitative information concerning the basic
hydrologic equation:
Groundwater recharge = groundwater discharge + change in
storage
The base flow recession equation is given by
Q = Qo.e-at (2)
Where Q is the flow at some time t after recession
started, Qo is the flow at the start of recession, a is a
recession constant for the basin and t is the time since
recession started.
This equation shows that Qo varies
logarithmically with time, t. A plot of a stream hydrograph
with discharge on a logarithmic scale and time on an arithmetic scale will
therefore yield a straight line for the base flow recession. The baseflow recession
starts with the first slope or the first low value of the recession graph and
ends with the first flood. The complete potential groundwater runoff (Qtp)
represents the runoff of a complete groundwater recession. It is calculated as
follows:
Qtp = (Qo * t1)/ 2.3 (3)
Qo = runoff at
time t = 0
t1 = time of a
logarithmic cycle of the recession,
The remaining potential groundwater runoff is calculated as follows:
Qt = Qtp / 10(t/t1) (4)
The difference between the remaining potential groundwater runoff (Qt)
at the end of one recession and the complete potential groundwater runoff (Qtp)
at the beginning of the next recession yields the groundwater recharge between
the two recessions (Figure 8). Table 3 shows the calculated Qtp and
Qt and the storage change in the study area.
Figure 8: Monthly
runoff of Eerste River at Faure near Strand (2002-2005).
Table 3: Baseflow analysis of rivers in the
study area with discharge measurements
|
River |
Qtp (m 3 ) |
Qt (m 3 ) |
Recharge (m 3 ) |
Period |
Rainfall (mm) |
|
Eerste at Faure |
1.97 x 10⁸ |
1.29 x 10⁷ |
1.84 x 10⁸ |
2002-2003 |
524.3-424.3 |
|
Eerste atFleurbaai |
5.41 x 10⁷ |
3.17 x 10⁶ |
5.09 x 10⁷ |
2002-2003 |
- |
|
Lourens atStrand |
2.13 x 10⁷ |
5.53 x 10⁶ |
1.58 x 10⁷ |
2002-2003 |
589.2-456.6 |
Conceptual hydrogeologic model
The first stage in the estimation of recharge in the study area involved collection and collation of existing data on potential controls of recharge, such as climate, hydrology, geormophology and geology, to develop a conceptual model of recharge into the aquifer system. The conceptual model describing the location, timing, and likely mechanisms of recharge into the Cape Flatsaquifer is illustrated in Figure 9.
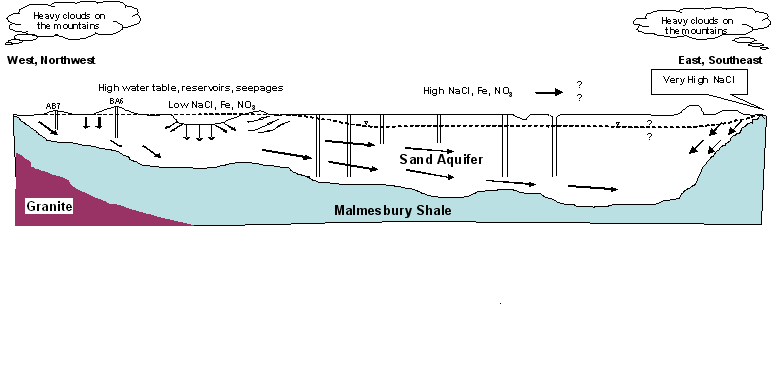 Figure 9: A
conceptual hydrogeologic model of the Cape Flats area.
Figure 9: A
conceptual hydrogeologic model of the Cape Flats area.
The source and recharge processes of different types of groundwaters with
their isotope and chloride data can be interpreted using Fig. 9, which
represents a conceptual hydrogeologic model of the Cape Flatsarea.
The model takes into account the following observations: (i) lithology as
revealed through a number of boreholes in the study area, (ii) geomorphic
variations, (iii) groundwater fluctuations, (iv) qualitative yields
of the aquifer, (v) variation of δ 18O and chloride
concentration in groundwater. The hydrogeologic model presented
above has some similarities with a conceptual model of groundwater flow
developed by Gerber (1981) for the Cape Flats aquifer. In this
model, on the basis of two aquifer test sites where groups of observation wells
were aligned in more than one direction respectively, Gerber presented that
there was evidence of anisotropy in the sand deposits of the Cape Flats.
In the hydrogeologic model developed in this study, it is believed that
this sandy aquifer, which is connected to the vadose zone, carry
recharge water laterally a few hundreds of meters to a few kilometers, which
could result in ageing of the recharged water. However, in contrast to the
above situation, younger ages with similar chemical and isotopic
characterization are obtained. This situation may occur due to the fact that
the aquifer system is generally unconfined in nature and infiltration and
movement of water through the matrix result in apparent young age of groundwater.
This situation can be described from the conceptual hydrogeologic model
(Fig. 9) in which wells like AB-7 and BA-6 are located where the source of
recharge is some distance away. In an actual field situation, the sampled
groundwater wells mainly tapping from the Cape Flats aquifer
represent the above hydrogeological situation. From hydrochemical and
isotopic data and considering extensive fracture zones in the neighboring TMG
with good yield (5–7 l/s) prevalent in the area, it is envisaged that groundwater
moves laterally through the sands for sufficiently long periods and over
distant areas as we have not observed any depth variation. Wu (2005), in
his attempt to model the groundwater flow and travel time through the fractured
zone of the Table Mountain Group (TMG), estimated groundwater recharge. According
to him, recharge is nearly vertical and the travel time to the saturated zone
is dependent on the thickness of the unsaturated zone and effective travel path
porosity. The flow path may be in a rock matrix or in fractures. Further, a
significant flux of recharge occurs through fractures under saturated or nearly
saturated conditions. Then, infiltrated water is expected to travel laterally
through the Cape Flats aquifer until intercepted by deep wells
in the weathered shale and granite of theMalmesbury. A higher infiltration rate
is assumed to take place through fractures while a lower value of infiltration
moves through the sands (inter-mixed with silt, clay and peat in places). If
this conceptualisation is correct, the pattern of the hydrochemical depth
profiles will not necessarily imply the slow passage vertically downward of a
‘front’ of urban recharge. Instead, a given profile could be the product of a
complex series of mixing ‘cells’, slowly evolving as water moves generally downdip (and
occasionally cross-dip along discontinuities) in the recharge area through the
sand aquifer and subsequently into the deeper fractured aquifers. This is
subject to further investigations and detailed groundwater evolutional studies.
However, despite the fact that the studied area have fractured hard rock
aquifer system (with a complex geologic environment comprising unsaturated rock
matrix and multiple fracture network) as its immediate neighboring aquifer, the
study has identified dominant recharge processes and flow mechanisms operative
in the area. The possible sources of errors that would offset the conceptual
data from its real value could be recharge contributions from unidentifiable
subsurface regimes as well as contribution from multiple fractured basement
aquifers during pumping of wells near the west and east boundaries
of the Cape Flats.
From an agricultural perspective, where irrigation water is available,
such areas can be used for intensive market gardening and potato cultivation.
However, it is these areas which are currently experiencing an explosion of
urban development. This includes the informal, and low-cost formal housing of
the Cape Flats, and the middle income development of the West Coast
(Table View) as well as developments such as CenturyCity. Such areas do
not place any particular constraints on construction. In fact, the nature of
the sandy substrate facilitates the digging of foundations and the emplacement
of infrastructure (pipes, cables). However, the low-lying nature of these areas
and their proximity to the ocean implies a high local water table and, in
specific areas, frequent waterlogging and localised flooding
in the winter months. Landfill sites, typically sited in such areas in the
past, are prone to seepage and groundwater contamination. Fruits and, in
places, vines are grown. Provided they are correctly managed (contour ploughing,
for example) they are not particularly vulnerable to erosion and will provide
sustainable crop yields. However, construction should be undertaken with
caution and only after thorough examination of the substrate.
Steps Towards Sustainable
Resource Management in the Western Cape
The people of Cape Town, through their citizen committees, their
local and regional agencies, and Department of Water Affairs and Forestry
(DWAF) under the Integrated Environmental Management (IEM) guidelines issued by
the City Council of Cape Town, are unanimous in their desire to extend and to
ascertain a basis for the development of future water supplies in the Western
Cape. These developments would be subject to a public participation process.
This warranted the commissioning of a comprehensive study in 1989 entitled the
Western Cape System Analysis (WCSA) by the DWAF in conjunction with the City
Council. The Cape Town Municipal Water Plan objectives call for utilization of
the Cape Flats aquifer by 2005 and implementation of enhanced
water management in targeted areas. The plan also calls for achievement of
sustainable management of both surface and groundwater sources within the
region by 2008 (in western and eastern catchments, where precipitation and
aquifer recharge are generally greater than in the central and northern areas)
and for meeting minimum desirable stream flow standards (established at 20
locations regionally) at a frequency no less than the historical achievement.
In the long term, it is impossible to extract more water from an aquifer than
is recharged to it by seepage from precipitation or surface water bodies and
flow from other aquifers. The key steps to move toward sustainable use of
groundwater are basic, but a sustainable groundwater management strategy can
only be as good as its potential for implementation. Several of the following
steps were outlined as implemented in other places (NRC 2000, Sophocleous 2002,
2004, 2002, among others), but they can be extended and applied to the Western
Cape conditions:
Improve the knowledge base.
Improve reporting and access to information.
Improve public education and better understand the public’s attitudinal
motivations.
Use the ecosystem approach to manage groundwater.
Embrace adaptive management.
Further improve water efficiency and crop productivity.
Exploit the full potential of the Cape Flats aquifer along
side with others.
Adopt a goal of sustainable use.
References
[1] BEKESI, G. & MCCONCHEI,
J. 1999. Groundwater recharge modelling using the Monte Carlo
technique, Manawatu Region, New Zealand. J hydrol.
224:137-148.
[2] BREDENKAMP, D.B., BOTHA L.J. & VAN RENSBURG, H.J. 1995. Manual on
quantitative estimation of groundwater recharge and aquifer storativity.
Rep TT 73/95. Water Research Commission, Pretoria, 419pp.
[3] BREDENKAMP, D.B. 1990. Quantitative estimation of groundwater
recharge by means of a simple rainfall-recharge relationship. In: D.N.LERNER, A.S. ISSAR & I. SIMMERS (eds.) Groundwater
Recharge, IAHMemoir 8:247-256.
[4] CATCHMENT, STORMWATER AND RIVER MANAGEMENT (CSRM) 2005.
Annual Report for 2004/2005.
[5] DOMENICO, P.A. & SCHWARTZ, F.W. 1998. Physical and
chemical hydrogeology (Chapter 17), 2nd edn. John Wiley & Sons, Inc. New
York, 506pp
[6] FETTERS, C.W. 1994. Applied hydrogeology, 3rd edn, Merril, Columbus,
691p.
[7] FRENCH, R.H., JACOBSON, R.L. & LYLES, B.F. 1996. Threshold
precipitation events and potential groundwater recharge. J. Hydraul. Eng. 122:573-578.
[8] GERHART, J.M. 1986.
Groundwater recharge and its effect on nitrate concentrations beneath a manured field
in Pennsylvania. Ground Water 24:383-389.
[9] GERBER, A. 1976. An investigation into the hydraulic characteristics of the
groundwater source in the Cape Flats. Unpublished M.Sc. thesis,
University of the Orange Free State, Bloemfontein
[10] GERBER, A. 1981. A
digital model of groundwater flow in the Cape Flats. CSIR Contract
Report C WAT 46, Pretoria.
[11] HARTNADY, C.J.H. & ROGERS, J. 1990. The scenery and
geology of the Cape Peninsula. Guidebook Geocon-gress ’90,
Geological Society, South Africa.
[12] HEALY, R.W. & COOK, P.G. 2002. Using groundwater
levels to estimate recharge. Hydrogeol. J. 10:91–109.
[13] HENZEN, M. 1973. The
reclamation, storage and abstraction of purified sewage effluents in the Cape Peninsula (in
Afrikaans). D.Sc. Thesis, University of the Orange Free State, Bloemfontein.
[14] MALAN, J.A. 1987. The Bredasdorp Group
in the area between Gansbaai and Mossel Bay. South Africcan journal
of Science 83, pp. 506-507.
[15] MEYBOOM, P. 1961. Estimating
groundwater recharge from stream hydrographs. Journal Geophysical Research
66:1203-1214.
[16] MORGAN, M.G. & HENRION, M. 1990. Uncertainty. A
guide to dealing with uncertainty in Quantitative Risk Analysis and Policy
Analysis. Cambridge University Press. ISBN
0-521-36542-2, 332 p.
[17] NINHAM SHAND. 1994. Western Cape System
Analysis: Study overview. NINHAM SHAND Consulting Engineers.
[18] NATIONAL RESEARCH
COUNCIL (NRC). 2000. Investigating groundwater systems on regional and
national scales. National Research Council, National Academy, Washington DC,
143 pp
[19] RASMUSSEN, W.C. & ANDREASEN G.E. 1959. Hydrologic budget of the Beaverdam Creek Basin, Maryland. USGS
Water-Supply Paper 1472:106.
[20] SCHALKE,H.J.W.G. 1973. The upper
Quaternary of the Cape Flats area, Cape Province, South Africa. Scripta Geol.
15, pp1-37.
[21] SCANLON, B.R., HEALY, R.W. & COOK, P.G. 2002. Choosing appropriate
techniques for quantifying groundwater recharge. Hydrogeol. J. 10:18–39.
[22] Simmers, I. (eds) 1988. Estimation
of natural groundwater recharge. NATO ASI series C 222, Reidel, Dordrecht.
[23] SOPHOCLEOUS, M.A. 2004.
Groundwater recharge and water budgets of the Kansas High Plains and related
aquifers. Kansas Geol. Surv. Bull. 249:1–102.
[24] SOPHOCLEOUS, M.A. 2002.
Interactions between groundwater and surface water: the state of the science. Hydrogeol.
J. 10(1):52–67
[25] SOPHOCLEOUS, M.A. 2000.
Quantification and regionalization of ground-water recharge in south-central Kansas:
integrating field characterization, statistical analysis, and GIS. Spec Issue,
Compass 75(2–3):101–115.
[26] SOPHOCLEOUS, M.A. 1991.
Combining the soil water balance and water level fluctuation methods to
estimate natural groundwater recharge: Practical aspects. J. Hydrology
124:229-241.
[27] THERON, J.N., GRESSE P.G., SIEGFRIED H.P. & ROGERS J. 1992. The geology of the Cape
Town area. Explanation on Sheet 3318, Geological Survey, South
Africa, 140p.
[28] THORNTHWAITE, C.W. & MATHER, J.R. 1957. Instructions
and tables for computing potential evapotranspiration and the water
balance, Publications in Climatology, 10 (3):183–311. Laboratory of
Climatology, Drexel Institute of Technology, Centerton, New Jersey, USA.
[29] WALKER, G.R., COOK, P.G. & GILFEDDER, M. 2002. Recharge/discharge
determination. In Fundamentals of Groundwater Science, Technology and
Management Vol. 2 – Technology, Australian GroundwaterSchool.
[30] WALKER, F. 1952. The
geology, In: The Cape Peninsula – Maskew Miller Ltd., Cape Town,
1-13. White, W.N. 1932. A method of estimating groundwater supply based on
discharge by plants and evaporation from soil. US Geological Water Supply Pap
659-A
[31] WU, Y. 2005. Groundwater
recharge estimation in Table Mountain Group aquifer systems with a case
study of Kammanassaie area. PhD Dissertation, University of the Western
Cape
[32] XU, Y. & BEEKMAN, H.E. (eds), 2003. Groundwater
recharge estimation in Southern Africa. UNESCO IHP Series No. 64,
UNESCO Paris. ISBN 92-9220-000-3.