


Achievements
CONCEPTUAL UNDERSTANDING OFFRACTURE NETWORK AND GROUNDWATER FLOW IN TABLE MOUNTAINGROUP (TMG)
L Lin, Y Xu , H Jia
Department of Earth Sciences, University of the Western Cape, Private Bag X17, 7535, Bellville, South Africa
E-mail: llin@uwc.ac.za, Tel: +27-021-9592413, Fax: +27-21-9592439
Abstract: Fractures are known to be most important in controlling groundwater flow path, mineral deposit and chemical dispersion through subsurface. The properties and patterns of fractures at various scales are indispensably studied by using imagery interpretation, field investigation and borehole loggings. Based on statistic approaches, fractures at the borehole sites of the Table Mountain Group (TMG) sandstones are carefully investigated in terms of fracture density, hydraulic conductivity and fracture connectivity using surface measurement, core logging, hydraulic tests, and numerical model. From borehole observation of the TMG sandstones, multiple conductive zones (2 to 4) with various pressure conditions are of a common phenomenon shows that there are quite few conductive fractures intercepted by a borehole and the water from different fracture systems may not communicates each other. This implies that the groundwater flow in the fractured rocks is in the form of relatively isolated systems mainly controlled by the connectivity of competent fractures, which is geometrically illustrated by fractures generated, based on the data derived from surface measurements. To consider the factors affect the connectivity, fractures are nevertheless boundedly connected and their boundary patterns depend on the scale of problems studied.
Key word: Fractured rock; Density; Hydraulic conductivity; Connectivity; Flow; Table Mountain Group (TMG)
1 Introduction
Fractures are mechanical breaks in rocks that involve discontinuities in displacement across surfaces and limited zones due to crustal tectonic driving forces (Pollard and Aydin, 1988). They are generally referred to as joints and faults, as well as varied discontinuities over different scales and lithologies. Different kinds of fractures exist with different geometries and mechanical effects, which provide an ideal conduit for groundwater flow throughout the upper crust (Sibson and Scott, 1998). In fractured rock, the properties of fractures are deduced through measurements on outcrops, aerial photography, and core samples, from which a statistical model of the fractured rock may be
generated. Further investigation and characterisition of
fractured rock require more comprehensive approaches (Karasaki et al, 2000; Kulatilake, et al, 2003; Serzu, et al, 2004). These methods detect the response of fractures rather than measure them directly (Berkowitz, 2002; Neuman, 2005). Moreover, the effectiveness of the methods is basically dependent on the attributes and scales of the problem studied (Karasaki et al., 2000).
In this paper, some characteristics of the fractures such as fracture density, hydraulic conductivity and fracture connectivity are analyzed, using surface measurements, core logging, hydraulic test, and numerical modeling, at the sites of Table Mountain Group (TMG) sandstones. The main objective is to provide a insight into the fracture networks and associated hydrogeological conditions by assessing the spatial correlation of fracture density and hydraulic conductivity, etc. Using statistic approaches and fracture generation technique, the fracture connectivity at the borehole sites are highlighted, with the intention of helping to explain groundwater circulation in or between boreholes and to establish a borehole-scale conceptual model.
2 Geologic Setting
The Table Mountain Group (TMG) extends from Western Cape to Eastern Cape in South Africa (Fig.1), comprising a thick sequence of hard sedimentary rocks dominated by fractured sandstones with a thickness ranging from 900 m to 5000 m (Rust, 1973). Extensive groundwater research, exploration and exploitation in TMG area have been undergone for more than 30 years. Due to the experiences of groundwater usage by borehole abstractions, together with the cognition of lithological characteristics, stratigraphic buildups and structural fabrics of the TMG, it has been concluded that the TMG is a regional aquifer system which extends to big depths. It has also been recognized that the fractured rock aquifers mainly comprise of sandstones, siltstones, and sandwiched shales and mudstones. As underlain by Precambrian metamorphic rocks, overlain by mid- to neopaleozoic basin deposits and bounded by some regional faults such as Kango and Worcester faults, the southmost aquifer system in African continent has the potential to become a major source of future bulk water supply for both agricultural and urban requirements in the Western and Eastern Cape provinces of South Africa. However, current understanding of the aquifer system is limited as regarding the hydrogeological settings, aquifer properties and accordingly the groundwater storage and circulation.
Tectonically,
the TMG region has been identified to be a part of African Craton. Structures in the TMG were produced by the development of the Cape Fold Belt during the Permo-Triassic
Cape Orogeny (De
Beer, 2001) extending from
3 Characteristic of Fractures
3.1 Development of fractures
The fractures developed in various structural parts of the TMG area are quit geometrically complicated, in which the length can range from hundreds of kilometers to few millimeters. Because of no enough neotectonic evidences such as large-scale terraces and frequent earthquakes, the outlines of fractures in TMG may be assumed to be strongly developed during the Paleozoic and Mesozoic Ages and gently reshaped in the Tertiary. In Quaternary, most of the fractures keep in previous shapes and the evidences of modification from crust movement are inconspicuous. Either by the interpretation of satellite imagery or by site measurement, the sets of fractures are no more than 4. Therefore, to the significance of groundwater flow, one of the important sets of fractures is bedding fractures which dominate not only spatial extension but connectivity of fracture systems as well. The others are structural fractures among which the widespread and predominant ones are conjugate joints with different length scales.
Some factors affecting the development of these fractures are summarized in Fig.2, which may help to explain the development and complexity of the fracture system in the study area. On one hand, the structures have been developed by multistage tectonic events and modified by later morphogenetical processes (Hartnandy and Hay1, 2001; Kotze, 2002) resulting in both various types of folds/faults and specific fracture systems in the field area. On the other hand, infiltration of meteoric water and precipitation of secondary minerals in the fracture walls tend to complicate the properties of the fractures.
3.2 Classification of fractures
The classification of fractures is conventionally based on mode of rock deformation or displacement that represents a broad mechanical classification (Pollard and Aydin, 1988; US Committee on Fracture Characterization and Fluid Flow, 1996):
i) Dilatant fractures;ii) Compaction fractures; and iii) Shear fractures/faults.
To designate the TMG fractures in the above classes, one must have not only the data of a single fracture as abovementioned but the analyses of fracture networks such as termination, hierarchy, and connectivity as well. In this case, it is extremely difficult to collect these data to identify the modes of such structures on surface or in holes, although the aerial and satellite imagery are used to interpret the fractures and fracture networks since most of the area are covered by weathered materials. As the current state of the fracture network has resulted from long-term geologic processes, what is of most concern is the percentage of open fractures where groundwater could be stored and the interconnectivity of the open fractures where flow could take place. Thus the classification of fractures as open or close may have more hydrogeological meaning to the study of a fractured rock aquifer if we realize that open fractures are a precondition for groundwater flow in the aquifer.
3.3 Density of fractures
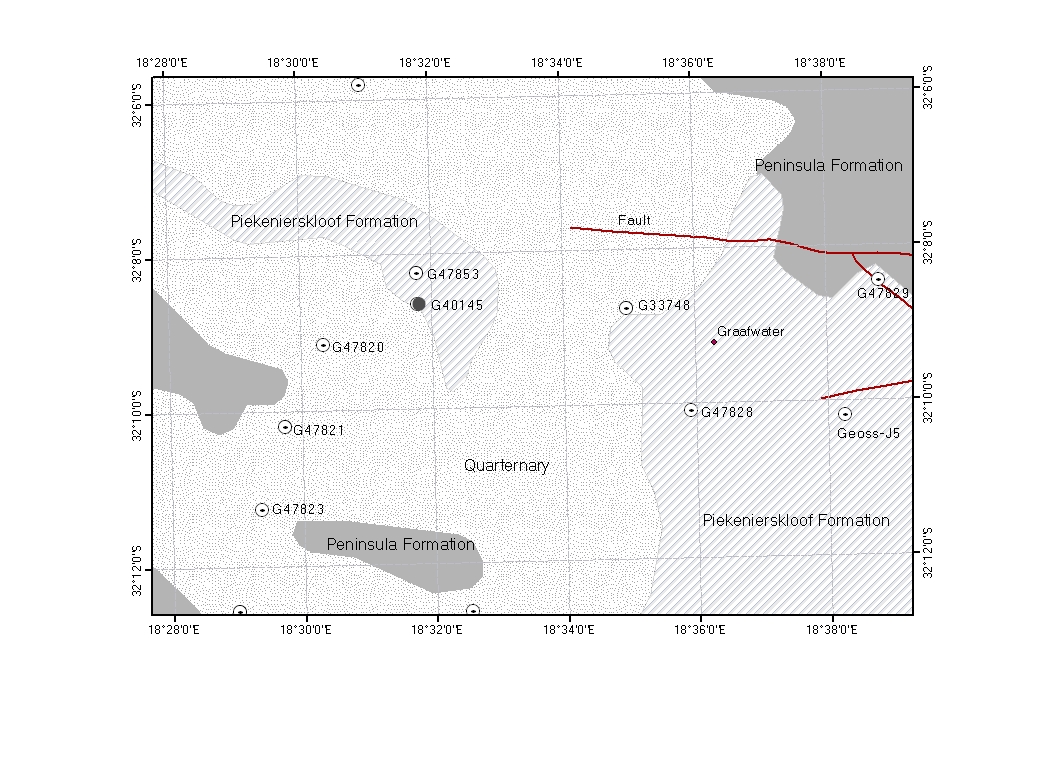
Fractures are always characterized by density or intensity of fracturing, which are often compared to rock type, geophysical investigation, and hydraulicconductivity estimation. The density of fracturing in fractures/cm was computed for all core fractures - bedding and structural fractures - observed between core depth tags without regard to the fracture orientation, fracture mode, and rock type. The frequency plots of these fractures observed with a logging interval of 2~5 m from the top cut-off to the bottom of boreholes at site 1 and site 2 (Fig.1) are shown in Fig.3. These plots show that the density of fractures gently decreases with depth. In comparison with traditional frequency distributions, they have very weak spatial correlations. For example the linear correlation coefficients between the fracture density and depth of the deep hole ate site 1 are 0.28, 0.33 and 0.16 with respect to linear, exponential and power distributions, respectively.
Snow (1968) points out that fracture spacing increases with depth, while aperture decreases. Although the density generally decreases with depth and 33% of fractures are concentrated in the top 160-m portion of the hole at site 1, fractures are not substantially depleted with depth in the sandstone predominant portion. The general shape of the density plot is an undulating pattern where relatively high fractured zones are located in the depth ranges of 70~125 m, 344~410 m, 560~598 m, and 668~697 m. For BH 2 at site 2, because of the effect of a normal fault, the top 40m is highly fractured and 77% of fractures are concentrated in the top 100-m portion. However, these highly fractured zones or the logging intervals of higher densities are not consistent with the positions of conductive zones which are open to the groundwater flow into the borehole. The artesian flow of the deep hole at site 1 is from 3 intervals of about 170 m, 210 m and 380 m below surface where the fracture density is 0.05, 0.09 and 0.13, respectively, which is below an average level of 0.15 (Fig.3a). Similarly, the artesian flow of BH1 at site 2 has been identified from two fractures located at a depth of 68.6 m and 94 m where the fracture density is 0.05 and 0.06, respectively, but the average value of this core fractures is 0.08 (Fig.3b).
3.4 Hydraulic conductivity of fractures
One important aspect of fracture hydrogeology is to estimate the hydraulic conductivity of the fracture network for numerical modeling and water resource estimation. Theoretically, the fracture density is proportionally related to fracture hydraulic conductivity and connectivity. Recent studies (Johnson, 1999; Khang et al, 2004), however, suggest that there is no strongly inherent relationship between fracture density and hydraulic conductivity. The main reason is that the hydraulic conductivity is dependent on not only the number of fractures but also the apertures within the logging intervals. For example, for closed fractures with a high density, their hydraulic conductivity tends to be extremely low or even zero. Contrarily, open fractures incepted by a borehole are more likely to yield higher hydraulic conductivities than that of closed ones, but these fractures are not always in conformity to hydraulic conductive zones.
In order to evaluate the hydraulic conductivity of the TMG sandstones, packer tests in two boreholes at site 2 (Fig.4) were completed with the packer interval of 6 m. In the hydraulic test, the injection pressure in a straddle packer was depth dependent and changed by stepwise as 350-700-1050-700-350 kPa below the depth of 40 m.
Hydraulic conductivity was calculated by the following formula suggested by Moye (1967) and cited by Park et al (2002):
![]() (1)
(1)
where q is flow rate (m3/s), H is injection pressure (m), L the packer interval (m), and rw borehole diameter (m).
Because the graphic circles of total working pressure and water take match well during the tests, the mean value of each stepwise test based on equation (1) is taken to be the hydraulic conductivity for each interval. Hydraulic conductivity against borehole depth in Fig.5 shows that the k value widely ranges from 1.11×10⁻⁶ to 9.28×10⁻⁸ m/s and 1.25×10⁻⁶ to 7.25×10⁻¹⁰ m/s in BH1 and BH2, respectively. In the top portion near the fault zone, the k values vary much and are higher than the lower portion of the boreholes. Below the depth of 60 m in BH1 and 80 m in BH2 the
variation of k values becomes stable and the k value gently decreases with depth in both boreholes. The hydraulic conductivity in an order of magnitude of -8 in BH1 and -8 ~ -10 in BH2 below those depths may represent that of the TMG fractured sandstones in this area. Note that there are many test intervals without water takes where the k=0, which also indicates that hydraulic conductivity from the packer tests depends on both the factors as listed in equation (1) but also the local connectivity of fractures in the fractured rock. Besides, Fig.5 doesn’t tell a generic trend of the hydraulic conductivity against depth because of the limitation of the borehole length. At depth, fracture apertures are affected by both roughness (Lomize, 1951; Louis, 1974; Barton et al. 1985) and stress conditions (Talbot and Sirat, 2001; Rutqvist and Stephansson, 2003), which means that the majority of fractures may tend to be closed in the deeper part of crust (Goodman, 1974).
A numerical model has been developed to delineate hydraulic aperture in the following equations. For an arbitrary fracture surface, with a dip azimuth of β and a dip angle of α, being subject to a combined three dimension stresses [σx, σy, σz, τxy, τyz, τzx] T, the normal stress σN and shear stress τs acting on the surface may be expressed as:
 (2)
(2)
the hydraulic aperture bh is composed of the equivalent aperture be due to fracture roughness, and normal displacement un and shear displacement us due to the effects of the stresses on the fracture walls, namely:
![]() (3)
(3)
The expressions of un and us have been discussed
by Lin and Xu (2006), from which the expression of the hydraulic aperture is:
![]() (4)
(4)
where σe and τs are the effective normal and shear stresses on fracture walls, respectively; Kn (kN/m) is the stiffness of fracture walls, approximately, kn=E/(pLf); G is the fracture rigidity modulus, G=E/2(1+v), E the elastic modulus (MPa) , Lf the fracture length (m), and v is the the poisson's ratio; M is the damage coefficien and JRCm the mobilized joint roughness coefficient (Olsson and Barton, 2001), and JCS the compressive strength of the fracture wall.
By replacing the physical aperture b with the hydraulic aperture bh, the tensor approach (Tian, 1988; Lin and Xu, 2006) can be use to compute the hydraulic conductivity at depths. Assuming that the rock masses around the borehole are subjected to lithostatic pressure, the vertical and horizontal stresses act on the rock masses is rh and nrh (h is the buried depth), respectively. Applying them to Eq. (2) to obtain the stresses impact on the fracture surfaces, the hydraulic apertures are determined by Eq. (4).
The model of hydraulic aperture that incorporates the roughness and combined stress conditions is applied in borehole at site 1 (Fig.6) to a depth of 750 m, using the fracture data derived from surface measurement and basic properties of rock materials in Fig.7. The computed hydraulic conductivity results are plotted in Fig.7 showing that the reductions of hydraulic conductivity over depths roughly follow a negative exponential law. The k value near surface zone is 7×10⁻⁴ m/d or 8.1×10⁻⁹ m/s, but than decreases to 9.4´10-6 m/d, 1.29´10-7 m/d and 8.2´10-11 m/d at depths of 200 m, 400 m and 750 m, respectively. The calculated result implies that fractures tend to be closed with depth.

3.5 Geometric property of fracture
network
The significance of fractures in controlling groundwater flow in a hard rock has long been discussed. To establish a relationship between hydraulically active fractures and groundwater flow often requires the input of geometric and physical information of fractures, such as fracture aperture, connectivity, and so forth. A relatively accurate characterization of fractured rock aquifers is extremely difficult since the fracture geometry properties are complex and heterogeneous. The physical and hydraulic properties of fractures cannot be fully known from a single case study. Groundwater flow can only takes place in those interconnected open fractures. However, the number of currently open fractures and how they connect one another cannot be fully known. From the experience of borehole observations, only a few interconnected open fractures are likely able to form flow paths. It is of interest to note, during the core fracture logging, that some steep fractures are partially coated while partially clean, which undoubtedly reflects the presence of partially closed fractures and implies the possibility of diverted flow in the fracture network. In light of this, fracture connectivity becomes very important in characterizing and predicting the flow system in fractured rock aquifers.
Most recent studies (Bradbury and Muldoon, 1994; Odling, 1997; Mo et al, 1998; Park et al, 2002; Min et al, 2004) on fracture connectivity based on numerical modelling regard fractures as a well-connected network on the scales of the problems studied. In situ borehole tests (Karasaki et al, 2000; Halihan et al, 2005) have shown that fractures developed in a rock mass are not always fully connected. Fracture interconnection may depend on both geometric and physical properties such as orientation, aperture, length, termination, and fracture filling.
Hereon, we use random process to generate the fractures based on the geometric data derived from field measurements in the area of TMG. The fundamental elements include fracture orientation (strike, dip azimuth and dipping angle), fracture length and the distance (spacing) of each set of fractures, in which the number of fractures measured must be enough to represent the population of fractures at the measuring sites. From the core observation, fracture orientations can be treated as invariables with depth.
In this case, fracture orientation follows a normal distribution based on statistics of the field data, and fracture length is lognormal from the data of remote sensing by considering the similarity of fractures at varied scale since the length is very difficult to trace on surface. The amount of each set of fractures is determined by their spacing, and accordingly the position of fractures follows a uniform distribution. Based on statistic feathers of fracture data measured, it is able to use the function of “random number process” in Microsoft Excel to generate geometric 3-D and on-profile fractures on a borehole scale. While generating fractures on profile (cross section), the real dipping angle of each fracture needs to be projected on the profiles with strikes (directions). The last step is to load up the fracture data generated in Excel to the software Arcmap for graphical processing by using a VBA subroutine, and the geometric connectivity analysis is done by the subroutine as well.
Fig.8 shows a generated fracture network based on data derived from surface measurements of site 1, which represent the assemblage of fractures other than the real position of each fracture in the vicinity of the deep hole. The pattern of fracture connectivity is denoted by the interconnected fracture blocks (Fig.8b). This does help to explain the existence of multiple water strikes or conductive zones in the deep hole where groundwater is coming from different fracture (blocks) systems perhaps without hydraulic connection. From borehole observations of the TMG wellfields, the phenomena of multiple water strikes or several conductive intervals in a borehole and no hydraulic communications taking place between the holes in a wellfield are commonplace in the TMG sandstone aquifers. Thus the connectivity pattern may help to establish a borehole-scale conceptual model for studying aquifer properties and borehole hydrogeological condition in a statistical sense, such as how to average out a suite of relevant parameters to apply to groundwater modeling, or how to effectively use a contour map of borehole water levels to present groundwater flow trends on a local or even a regional scale.
Fig.9
provides another example of the isolated interconnected fracture systems
generated based on the data measured on TMG outcrop
at Eseljagberg,
4 Summary
Some fracture
characteristics and their link to the hydrogeology of the TMG have been
analysed statistically, which indicates that fracture data from surface
measurements and core logging are very important to interpret hydrogeological
significance in the case of being difficult to employ some specific
investigation tools. Fracture data scanned from core samples enable us to
present fracture density which present fracture density which present fracture density which be compared with
hydraulic conductivity carried out using packer tests. In terms of the spatial
correlations of the fracture network characteristics, the relationship between
fracture density and depth is very weak. The hydraulic conductivity estimated
frompacker tests doesn’t give a generic
trend of the hydraulic conductivity against depth due to the limitation of the
borehole length and the
effect of fault.
present fracture density which be compared with
hydraulic conductivity carried out using packer tests. In terms of the spatial
correlations of the fracture network characteristics, the relationship between
fracture density and depth is very weak. The hydraulic conductivity estimated
frompacker tests doesn’t give a generic
trend of the hydraulic conductivity against depth due to the limitation of the
borehole length and the
effect of fault.
However, the result of hydraulic conductivity from the estimation using tensor approach shows that the reductions of hydraulic conductivity over depths roughly follow a negative exponential law, which implies that fractures tend to be closed with depth.
Based on fracture surface measurements and fracture statistics, 3-D and 2-D realities are generated attempting to explain some phenomena of the borehole observation in the TMG fractured rocks, from which the most important contribution to the study of fractured rock is the various patterns of interconnected fracture network. This provides a conceptual understanding on the aquifer behaviors, suck as multiple conductive zones with different piezometric heads in a single hole and big difference of water levels between boreholes in a wellfield, and most importantly help to establish the conceptual model during numerical modeling.
Reference
[1] Barton NR, Bandis SC and Bakhtar K, 1985, Strength, Deformation and Conductivity Coupling of Rock Joints, International Journal of Rock Mechanics and Mining Sciences, 22(3): 121–140.
[2] Berkowitz B, 2002, Characterizing flow transport in fractured geological media: A Review, Advance in Water Resource, 25:861–884.
[3] Bradbury KR and Muldoon MA, 1994, Effect of fracture density and anisotropy on delineation of wellhead protection area in fractured-rock aquifers, Applied Hydrogeology, 3/94: 17–23.
[4] De Beer CH, 2002, the Stratigraphy, Lithology and Structure of the Table
Mountain Group, A Synthesis of the Hydrogeology of the Table Mountain Group-
Formation of a Research Strategy, WRC,
[5] Goodman RE (1974), The mechanical properties of joints, Proc 3r Int. Congr., Int. Soc. Rock Mechanics, Denver, Colo., 1-7 September, Vol. I: 127-140.
[6] Halihan T, Love A, and Sharp J M, 2005, Identifying Connections in a Fractured Rock Aquifer Using ADFTs, GROUND WATER, Vol.43, No.3: 327–335.
[7] Hartnandy CH and Hay ER1, 2001, Fracture system and attribute
studies in Table Mountain Group groundwater target generation, A Synthesis of
the Hydrogeology of the Table Mountain Group-Formation of a Research Strategy,
WRC Report No. TT 158/01,
[8] Johnson
CD, 1999, Effects of Lithology and Fracture Characteristics on
Hydraulic Properties in Crystalline Rock: Mirror Lake
Research Site,
[9] Karasaki K, Freifeld B., Cohen A., Grossenbacherb K., Cook P., Vasco D., 2000, A multidisciplinary fractured rock characterization study at Raymond field site, Raymond, CA, Journal of Hydrology, V236 (2000): 17–34.
[10] Khang ND, Watanabe K and Saegusa H, 2004, Fracture step structure: geometrical characterization and effects on fluid flow and breakthrough curve, Engineering Geology, 75(2004): 107–127.
[11] Kotze
JC, 2002, Towards a management tool for groundwater exploitation
in the
[12] Kulatilake P, Jeong-gi Um, Wang M, Escandon R and Narvaiz, J, 2003, Stochastic fracture geometry modeling in 3-D including validations for a part of Arrowhead East Tunnel, California, USA, Engineering Geology, V.70 (2003): 131–155.
[13] Lin L and Xu Y, 2006, A tensor approach to the estimation of hydraulic conductivities in Table Mountain Group aquifers of South Africa, Water SA, Vol.32, No. 3.
[14]Lomize GM, 1951, Filtrasia v treshinovatykh porodakh (flow in fractured rocks), Gosudastvennoe Energetitcheskoe Izdatelstvo, Moskva-Leningrad.
[15]
Louis C, 1974, Introduction to Rock Hydraulic, Bureau Researches Géologiques et
minières, Orleans
[16] McCathy T and Rubidge B, 2005, the Story of Earth and Life, a South African Perspective on a 4.6-billion-year Journey, New Holland Publishing (South Africa): 184–211.
[17] Min KB, Rutqvist J, Tsang CF and Jing L, 2004, Stress-dependent permeability of fractured rock masses: a numerical study, Inter J. Rock Mechanics & Mining Sciences, 41 (2004): 1191–1210.
[18] Mo H, Bai M, Lin D and Roegiers JC, 1998, Study of flow and transport in fracture network using percolation theory, Applied Mathematical Modelling, 22 (1998): 277–291.
[19] Neuman SP, 2005, Trends, prospects and challenges in quantifying flow and transport through fractured rocks, Hydrogeology Journal, v13 (1), 124–147.
[20]
Odling NE, 1997, Scaling and connectivity of joint systems in sandstones from
western
[21] Olsson R and Barton NR, 2001, An Improved Model for Hydraulic Coupling During Shearing of rock Joints, International Journal of Rock Mechanics & Mining Science, 38(2000): 317–329.
[22] Park BY, Kim KS, Kwon S, Kim C, Bae DS, Hartley LJ, and Lee HK, 2002, Determination of the hydraulic conductivity components using a three-dimensional fracture network model in volcanic rock, Engineering Geology, 66 (2002): 127–141.
[23] Pollard DD and Aydin A, 1988, Progress in understanding jointing over the past one hundred years, Geological Society of America Bulletin, 100, 1181–1204.
[24] Rust, IC, 1973, The evolution of the Palaeozoic Cape
basin, southern margin of Africa in The Ocean
Basins and Margins, Volume 1. The South Atlantic (A.E.M. Nairn and F.G.
Stehli, eds.): Plenum,
[25] Rutqvist J and Stephansson O, 2003, the Role of Hydromechanical Coupling in Fracture Rock Enginnering, Hydrogeology Journal, 11(2003): 7~40.
[26] Serzu MH, Kozak ET, Lodha GS, Everitt RA and Woodcock DR, 2004, Use of borehole radar techniques to characterize fractured granitic bedrock at AECL’s Underground Research Laboratory, Journal of Applied Geophysics, 55 (2004): 137– 150.
[27] Sibson,
R.H., Scott, J., 1998. Stress/fault controls on the containment
and release of overpressured fluids: examples from gold-quartz vein systems in Juneau, Alaska; Victoria,
[28] Snow, DT, 1968, Hydraulic characteristics of fractured metamorphic rocks of the Front Range and implications to the Rocky Mountain Arsenal well, Colorado School of Mines Quarterly, v. 63, no.1.
[29] Talbot CJ and Sirat M, 2001, Stress control of hydraulic conductivity in fracture-saturated Swedish bedrock, Engineering Geology, V.61 (2001): 145–155.
[30] Tian K, 1988, An almost developed Technique of karst collapse prevention during mine drainage, Proceedings of the IAH 21st Congress, Vol.21, Part 2.
[31]