


Achievements
SHALOW SUBSURFACE THERMAL REGIMES AND HYDRODYNAMICS IN JAKARTA GROUNDWATER BASIN, INDONESIA
Rachmat Fajar Lubis1, Yasuo Sakura2 , Robert M Delinom3
1. Graduate School of Science and Technology, Chiba University, 1-33 Yayoi-cho, Inage-ku, Chiba-shi, Chiba 263-8522, Japan E-mail address: fajarlubis@graduate.chiba-u.jp Tel.: +81-80-5674-1972, Fax: +81-43-2902859
2. Department of Earth Sciences, Chiba University, 1-33 Yayoi-Cho Inage-Ku Chiba-Shi 263-8522, Japan
e-mail: ysakura@faculty.chiba-u.jp Tel.: +81-43-2785695, Fax: +81-43-2902859
3. Research Center for Geotechnology, Indonesian Institute of Sciences, Jln Cisitu Sangkuriang,
Abstract: The shallow subsurface thermal regime of Jakarta groundwater basin, Indonesia and its relation to hydrodynamics is studied by means of available geological and geothermal data. Several Tertiary to Quaternary aquifers have been identified, together with potential recharge and discharge areas.
This paper intends to provide some evidence of interactions between the two competing effects that we can see at depths about 40-200 m in
Key words: Thermal regime, hydrodynamics,
1 Introduction
It is well known among hydrogeologist that the distribution of subsurface temperature is affected by groundwater flow, and that temperature data can be used to evaluate the direction and velocity of groundwater flow. There are some studies (Cartwright, 1970; Sakura 1978) where temperature data were used to understand the groundwater flow in the basin. Hydrogeologists, on the other hand, are interested in analyzing the thermal anomalies caused by groundwater flow in order to delineate groundwater recharge/ discharge areas and to estimate recharge/discharge rates independently of head data (
2 Study Area and Measurement Method
Jakarta groundwater basin, it is one of the most developed basins in
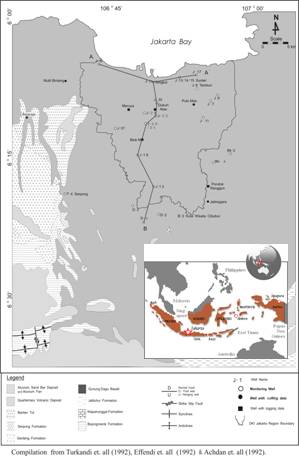
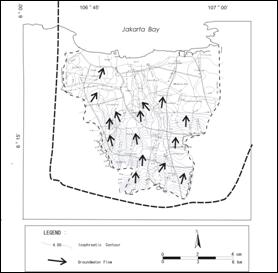
Figure 1. Location of the study site and observation well distribution
The thermal profiles and water levels in 51 observation wells (40 - 200 m deep) were measured in the study area, in July, 2004. The thermal-profile measurements were made at 2-m intervals from the water level to the bottom of the hole with a digital thermister thermometer of 0.01 °C precision. The boreholes selected are observation wells, therefore ideal for thermal studies. Due to the time elapsed since their construction, they can be considered to have attained thermal equilibrium conditions between water in a borehole and surrounding subsurface temperature. Compiled from 51 observations well, 25 observations well were giving a good data (Fig.2).
Figure 2. Temperature-Depth Profile on 25 observations well in Jakarta Groundwater Basin.
3 Results
Results are given in term of distribution of hydraulic head, subsurface temperature and subsurface temperature gradient, base on data measurement.
3.1 Distribution of hydraulic head
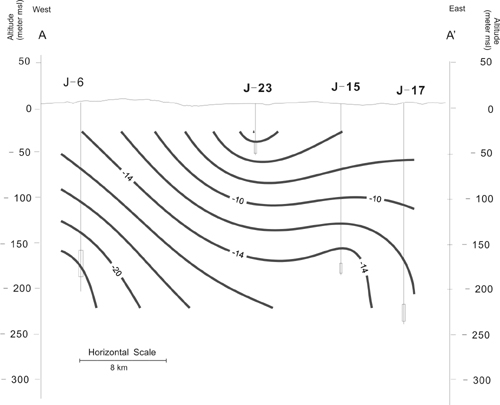
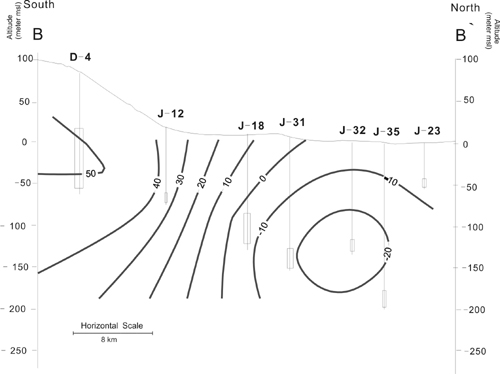
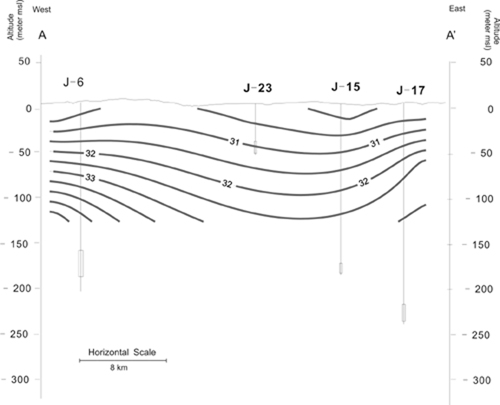
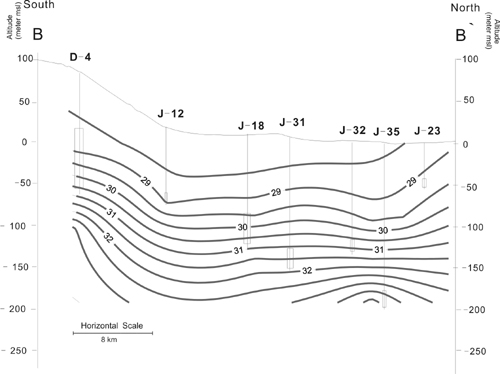
From cross section A-A` and B-B` (figure 1), hydraulic heads are high in the surroundings of the basin such as hills or uplands, and low in the lowland which is located along the river and the coastal area. Areas with high hydraulic heads located on hills and uplands around the basin, and hydraulic heads gradually decrease from highlands to lowlands. Especially, in the lowland which is located in central to northern part of the basin, hydraulic heads are anomalous low because of heavy pumping. These distributions show the existence of groundwater flow system, which in natural groundwater is recharged in upland and discharged at lowland (figure 3).
(a) (b)
Figure 3. Vertical distribution of hydraulic heads in cross section along (a) A–A`, (b) B–B` in Fig. 1.
3.2 Distribution of subsurface temperature
From cross section A-A` and B-B` (figure 1), vertical distribution of subsurface temperature along same sections, respectively. Subsurface temperature is low in the surroundings of the plain such as hills and uplands and high in lowland which is located in the central part of the plain (Figure 4).
Fig. 5 shows horizontal distribution of subsurface temperature at an elevation of 40 m below sea level taken from 25 observations well. The distribution of subsurface temperature estimated some local groundwater flow system. This can be affected by changes in surface temperature due to urban warming, influence of the river-groundwater interaction (Main Rivers in
Fig.5b. shows horizontal distribution of subsurface temperature at an elevation of 140 m below sea level taken from 6 observations well. In compared with the shallow layer, locations of areas with high and low temperature show the same pattern. Groundwater flows mainly from South - Southeast to north - Northwest
(b) (a)
Figure 4. Isotherms of subsurface temperature in the same cross section in (a) Fig. 2a, (b) Fig. 2b.
(a) (b)

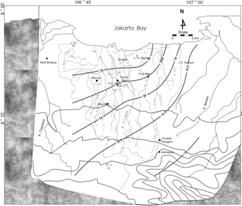
Figure 5. Isotherms of subsurface temperature at (a) 40 m and (b) 140 m below sea level.
3.3. Distribution of subsurface temperature gradient
Fig. 6 shows horizontal distribution of subsurface temperature gradient. In this case, thermal gradient was determined by a least-square fitted straight line the bottom temperature of a borehole employs a statistical approach. In this study, depths of wells are shallower than 300 m. Therefore, the thermal gradient contains the effect of heat conduction and heat advection by the groundwater flow. Areas with the high temperature gradient are located on the central to northwest part of the basin (4 - 6 0C/100 m). An area with low temperature gradient locates on hills and upland in the periphery of the basin (< 4 0C/100 m).
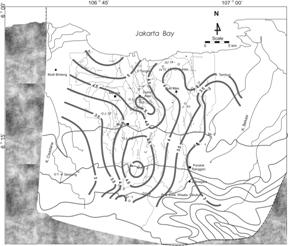
Figure 6. Distribution of subsurface temperature gradient.
4 Discussions
Discussion based on the result, will show groundwater flow system from distribution of subsurface temperature and classification of discharge and recharge area based on subsurface temperature profiles.
4.1. Groundwater flow systems from distribution of hydraulic head and subsurface temperature
From the relationship between distribution of subsurface temperature and distribution of hydraulic head, as shown in figure 7. Regional groundwater flow system was from south to north. It is suggested as follow; low thermal and highland areas, such as hills and upland around the plain, are recharge areas.
Areas with low temperature are located on southern part of the basin, uplands and hills up to 50 m elevation in the basin. On the distribution of the subsurface temperature gradient, hills and uplands have low gradients and the central part of the plain has high gradient. Groundwater flows mainly from South - Southeast to north - Northwest.
Therefore, it is possible to estimate the local groundwater flow system from subsurface temperature. It shows the existence of regional groundwater flow system, in which the discharge area is the central to northern part of the basin. Thus, the groundwater flow system which is estimated by the distribution of hydraulic head and subsurface temperature shows characteristics of natural groundwater flow system, which is affected by the condition of topography and hydrogeology.
Figure 7. Contour map of groundwater flow system base on hydraulic head measurement
4.2 Classification of discharge and recharge area based on subsurface temperature profiles
Three types of temperature profiles classified by shape have generally characteristic are identified in this area (Fig. 3): (1) upward concave, (2) transition, and (3)upward convex. Following Taniguchi (1999), it can consider two zones in the subsurface, the surficial zone and the geothermal zone. In the absence of ground water flow, subsurface temperature in the geothermal zone normally follows the geothermal gradient.
Based on temperature-depth plot in each type of observation well. In the recharge area, the plot has a positive straight-line slope (increasing thermal gradient with depth). In the intermediate area, the plot has reflect differences in the geohydraulic properties of the aquifers penetrated in the borehole as well as variations in thermal regimes between conductively and convectively driven heat-transfer processes. These are restricted phenomena that therefore reflect local characteristics of the flow system. In the regional-discharge area, the plot has a negative straight-line slope (decreasing thermal gradient with depth) that indicates ascending water infiltration and clearly represents discharging wells.
Compare with the gradient thermal distribution in Figure 10. Generally, base on geothermal distribution in Indonesia Map, in
Therefore, we can classify; recharge type has low temperature gradient, less than 4 0C/100 m. The discharge area has high temperature gradient, more than 5 0C/100 m. The intermediate area has stable temperature gradient about 4 - 5 0C/100 m.
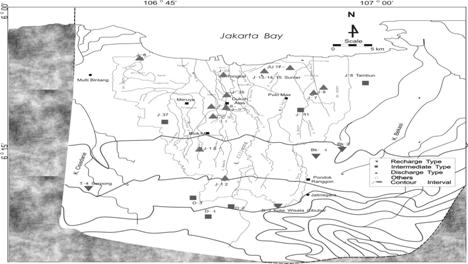
The result as shown in figure. 8, the main recharge area is adjacent to the southwest highland, the main discharge area is at the northern edge of the lowland, and the intermediate area of local recharge and discharge occupies the middle of the lowland. The main or dominant groundwater-flow direction is therefore from the southwest to the northeast. The regional groundwater-flow system is created by the recharge of surface water in the southwest highland, in the middle area and deep groundwater flow to the regional-discharge area near the coastal area.
5 Conclusions
Subsurface temperature and hydraulic head were measured in 51 observation wells in the
The distribution of hydraulic head, water table measurement and subsurface temperature suggests the existence of regional groundwater flow system in the basin. The recharge area is distributed in the hills and uplands which are located in the periphery of the basin, and the discharge area is located in the central and northern part of the basin. Groundwater flows mainly from South - Southeast to north - Northwest. This distribution shows the characteristics of natural groundwater flow system, but the shallow subsurface temperature is hardly affected by the change of surface temperature due to urban warming, influence of the river-groundwater interaction or human activities such as groundwater pumping
The main purpose of this paper was intends to provide some evidence of interactions between the two competing effects that we can see at depths about 40 - 200 m in
Figure 8. Distribution types of the subsurface
References
[1] Anderson, P.M, 2005, "Heat As A Groundwater Tracer". Groundwater, Vol 43. No, 6.
Cartwright, K. 1970. "Groundwater discharge in the Illinois basin as suggested by temperature anomalies". Water Resources Research 6, no. 3: 912 - 918.
[2] Fachri, M., Djuhaeni, Hutasoit, L.M., and Ramdhan, A.M., 2003. "Stratigrafi dan Hidrostratigrafi Cekungan Airtanah Jakarta", Buletin Geologi, Institut
[3] Rutherford, 1981. "Geothermal Gradient Map of
[4] Sakura.Y, 1978. "Study on groundwater cycle by water temperature". Water Balance in
[5] Schmidt. G, Hobler M & Soefner B, 1986. "Jakarta Groundwater Study" Working Paper 117, Directorate of Environmental Geology,
[6] Taniguchi, M., J. Shimada, T. Tanaka, I. Kayane, Y. Sakura, Y. Shimano, S. Dapaah-Siakwan, and S. Kawashima.,1999. "Disturbances of temperature-depth profiles due to surface climate change and subsurface water flow: 1. An effect of linear increase in surface temperature caused by global warming and urbanization in the Tokyo metropolitan area, Japan". Water Resources Research 35, no. 5: 1507-1517.
[7] Thamrin M, 1985. "An Investigation of The Relationship Between The Geology Of Indonesian Sedimentary Basins and Heat Flow Density." Tectonophysics J. 121. 45-62.